2008 Stock Market Crash
Post on: 17 Июль, 2015 No Comment

Note: I originally wrote this article in October of 2008. To read a more current article with background information on a stock market crash in general (written in August, 2011) continue here: Stock Market Crash Background .
There is no doubt that the 2008 stock market crash (October 5, 2008) has caused stress in many lives. I have written this article to provide some material to use for comparison of past economic downturns such as the 1930’s U.S. Stock Market Depression Era, and help people become aware of some possible outcomes.
Keep in mind that everything I am providing is based on my opinion and are only possible projections, not to be considered financial advice. Please consult your financial advisor before making any financial decisions, and most of all use your own judgement.
Part of the stress and pain that comes with an economic downturn, is from not being aware, educated and prepared ahead of the downturn.
For example, if you knew you would be getting a pay cut in a month, you may decide not to spend as much money on discretionary purchases. If you did not know the pay cut was coming, and made extra discretionary purchases, it would probably provide you with unnecessary financial and emotional stress.
The best way to learn about anything, including a stock market crash, and make ourselves aware of possible outcomes is to use history to make comparisons. I know there are people that say this time is different, but if you take a look at past downturns, there were always people who said the same thing. There always will be.
If history is not a good comparison to use to educate ourselves, then why do people spend money going to college to learn about what has already happened and is known to work?
In addition to the page you are currently reading, I have the following pages that show some more details using 1930’s stock charts as well as a page comparing the 2008 market downturn to three other bear markets including the 1930’s U.S. Depression Era.
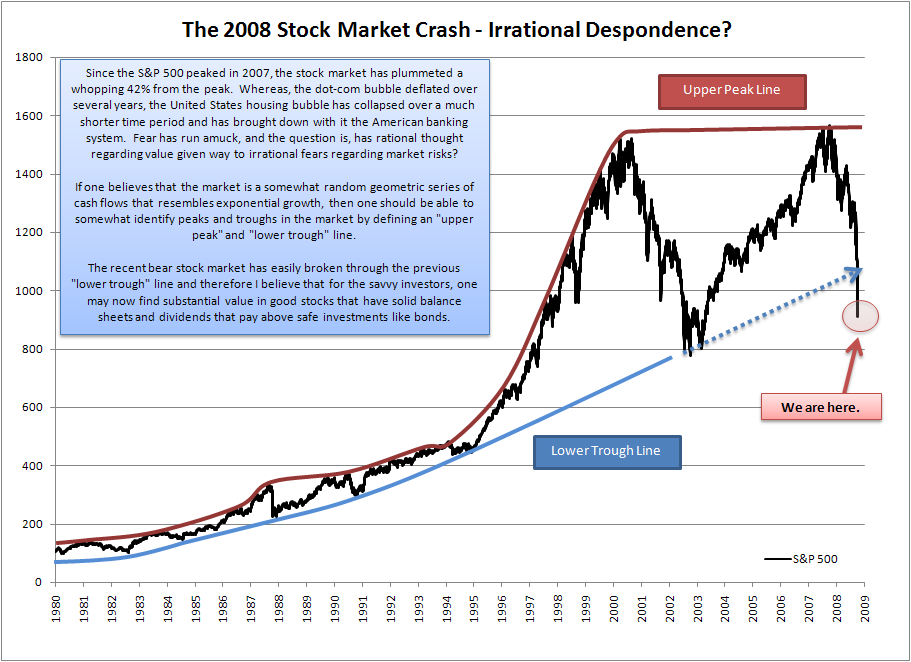
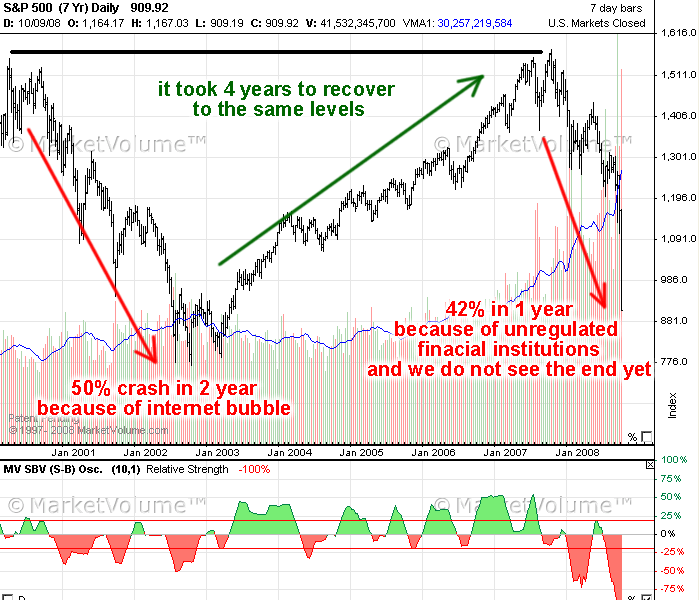
Many people consider the definition of a stock market crash to be different things. I am not going to dispute different definitions. Everyone has there own opinion, including me. In my opinion, the current decline of more than 40% in the U.S. Stock Market in a year’s time is a stock market crash. Think about all of the wealth that has been evaporated out of people’s savings and retirement accounts. If this is not a crash, I don’t know what is.
For many years we were in what was considered a Bull Market in stocks. In other words, the common thought was that stocks would always rise, eventually.
The opposite would be a Bear Market. A Bear Market occurs when stocks decline, some say by an amount exceeding 20%. During a Bear Market, a Recession can occur, which by some definitions is a negative GDP (Gross Domestic Product‘s produced) for two consecutive quarters.
By the time you hear about a Recession, it has already started due to the fact that economic figures are usually lagging indicators.
Over the past few month’s people have been referring to a Recession as the R word and talking about the current stock market crash. Soon, you may be hearing about the D word, or the Big D, a Depression. An economic Depression is an economic downturn that lasts several years.
The first chart below shows the Dow Jones Industrial average from late November 1929 to January 1930. Notice the overall drop from the high in September 1929 to the low in November 1929 was approx. 47%. This was over a 2-1/2 month time frame, a stock market crash.
What do you think everyone was saying after the 47% drop in such a short time? I haven’t done further research yet, but I can almost guess that people were saying that stocks were cheap and were bargains after the tremendous decline. Sound familiar yet?
Now let’s take a look at the Japanese stock market showing the decline around 1986, a stock market crash. Notice the overall drop was very close to the drop shown on the previous chart of the Dow Jones in late 1929. The difference is that this drop in the Japanese stock market occurred over a 9 month period.

Finally, let’s take a look at a chart of the Dow Jones Industrial Average showing the current decline from 2007 thru the beginning of October 2008. You will notice the same approx. decline in the 40+% range as in the two previous charts, a stock market crash.
Notice that if we analyze what has happened in the past, we can see that using the charts I have shown, the same outcome has occurred two separate times, and appears to be nearing a third time. Notice the almost identical declines from the three different charts.
Using the previous charts showing economic downturns may indicate that a near term bottom using a closing day price of between 7000 and 8000 may be a real possibility.
This in fact is proof that we can use past history as a tool for making ourselves aware and prepared for what can happen, so that we can take any appropriate steps that may be necessary.
Unfortunately, the government must not be taking such a close look at history to take actions necessary to prevent possible future negative outcomes.
It seems to me that the same, or similar steps are being taken, as well as comments such as everything can only get better from here, are occurring just as in the past.
For more information from someone who has been warning about the stock market crash of 2008 for years and to get a better understanding of the current position of the stock market and it’s possible future forecast, I recommend you take the initiative and learn about the Elliott Wave theory and it’s uses.


