2001 Stock Market History Enron Bankruptcy
Post on: 8 Май, 2015 No Comment

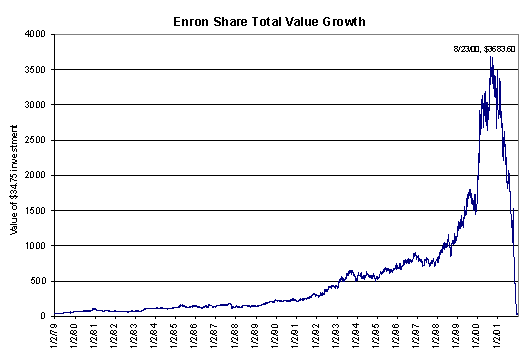
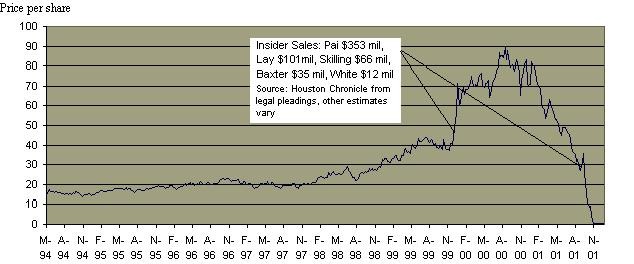
The Enron bankruptcy was among the most surprising and shocking events that the investing world has ever seen. Never before had a company once been held in such high regard, respected and even honored among the top companies in the Fortune 500 and across the world. This tragedy forever shook the confidence of the individual investor about Wall Street and the general integrity of mankind.
If you werent paying attention back then, you might not now realize the magnitude of what really happened. Not only was Enron a highly diversified company, dipping its toes in natural gas, electricity, paper and pulp, and communications, but it was also an undisputed leader in the energy space. For investors at the time, everything seemed smooth. They paid a dividend at around 0.5% 1%, they boasted steady and growing earnings, and even had a mostly average P/E ratio in the beginning of 1999, at around 30. Everything seemed to be going according to plan.
Just how well respected was Enron? Well, Fortune magazine had heralded the company as Americas Most Innovative Company for six years in a row. Behind the scenes, top executives were cooking the books and hiding company losses to avoid suspicion. But even though the Enron bankruptcy is widely known as the accounting scandal that caught everyone off guard, Id like to argue that a prudent investor would never have bought stock in the company in the first place.
The way that Enron cooked the books was through a method called mark-to-mark accounting. What this would entail, according to The Fall of a Wall Street Darling by Investopedia, was the immediate credit of an expected assets profits. For example, the company would build an asset, like a power plant, and then would count earnings on that asset before they even materialized. After that Enron would transfer the asset to an off-the-books corporation, so that when the actual loss was accounted for, it wouldnt affect Enrons bottom line.
Now of course this is highly deceitful and unpredictable. There was no way for the average investor to be able to research and find out this was going on. But there were some other warning signs going on in the financial statements, ones that youd only find out if you look past the superficial earnings and income numbers.
Take a look at their last annual report before bankruptcy, the one filed in 2001 (I took the liberty of filling out a spreadsheet for you with just the important numbers).
Again, on the surface everything checks out. You see growing revenue. Growing earnings, EPS, even a stock split. You see everything trending in the right direction up. Total assets, shareholder equity, and of course share price.
But lets look further. The reason why a tool like the Value Trap Indicator works so well is that it takes seemingly meaningless data and transforms it into something useful. We are able to understand if a particular ratio is extremely high or low because the Value Trap Indicator computes this automatically. Because the Value Trap Indicator is centered on a ratios desired average, and because many of the categories deal with the difference to the average as raised to the second power, extremes in ratios are quickly identified and flagged. You cant hide from it, not even Enron.
So if we extend down the spreadsheet to look at other ratios, we see an interesting anomaly. Remember, most of the ratios look great. Even though the P/B, P/E, and P/C get pretty high at some points, they dont get high enough to really cause us to worry. The red flags pop up, as they usually do, with the debt to equity ratio. Look at its progression below.
The Debt to Equity ratio takes a nice turn downwards in 1999, but it shoots up again in 2000. This is our major warning sign. You have to remember that the Debt to Equity of an average company is usually around 1. A favorable one is below 0.5. So really in this situation, Enron is 6-10x more leveraged than wed prefer.
You know, Ill be the first to admit that the Value Trap Indicator DID NOT flag a strong sell signal for this company. Of the 35 major S&P 500 bankruptcies since 1994, this was one of the few that didnt get accurately predicted.
But consider that this scenario was looked upon as the ultimate shocker. What would a follower of the Value Trap Indicator have done? Well for one, youd never have been stuck in the stock. So yes, even though the indicator wasnt able to predict the most surprising Wall Street bankruptcy of all time, the indicator also never flashed a buy signal in the preceding years. You can clearly see that above (VTI < 250 is a Strong Buy; VTI > 800 is a Strong Sell).
What we can learn from the Enron bankruptcy is the importance of examining every aspect of the financial statements. That means not ignoring the balance sheet, cash flow statement, or income statement. Each are critically important if you want to understand the full risks behind a company.

A company that is confident enough to pay a dividend rarely goes bankrupt. Yet as we can see with this example, even the most trickiest of accounting gimmicks isnt able to be hidden very well. While all categories seemed healthy, the balance sheet (with the debt to equity ratio) uncovered that the health of Enron was suspect, and that their earnings were unsustainable.
When you are investing in stocks out there, beware of an increasing Debt to Equity ratio. Even a strong leader in their field, such as Enron, is not invincible from the unforgiving consequences of overleverage.
============================================
This blog post is part of the Stock Market History series. This series tries to uncover what went wrong in the biggest stock market bankruptcies, and how investors can use these lessons to prevent major losses in their own portfolio. This Stock Market History series shows the Value Trap Indicator values in the years right before a company went bankrupt. As youll soon see, many of these bankruptcies couldve been easily avoided by following the Value Trap Indicator.
Today, theres one portfolio that utilizes the Value Trap Indicator to find the best deals in todays market for continuous compounding and superior returns. Those stock buy ideas are published monthly in the Sather Research eLetter, complete with research and Value Trap Indicator values. To subscribe to the Sather Research eLetter, click here .
**2001 Stock Market History: Enron Bankruptcy**
**All Rights Reserved. Investing for Beginners 2014**


