Using the PriceToEarnings Ratio to Value a Stock
Post on: 22 Апрель, 2015 No Comment

The New Investor’s Guide to Understanding the P/E Ratio
The p/e ratio, or price-to-earnings ratio, is a valuation tool that tells you how much you are paying for each $1 in earnings per share a stock generates. Sometimes, what looks like a low p/e ratio stock can be a trap. Jeffrey Coolidge/Riser/Getty Images
Value investors have long considered the price earnings ratio (p/e ratio for short) a useful metric for evaluating the relative attractiveness of a company’s stock price. Made popular by the late Benjamin Graham. who was dubbed the Father of Value Investing as well as Warren Buffett’s mentor, Graham preached the virtues of this financial ratio as one of the quickest and easiest ways to determine if a stock is trading on an investment or speculative basis.
Keep in mind as you learn about how to use the p/e ratio, you can’t always rely on price-to-earnings ratios as the be-all-end-all. There are some significant limitations, partly due to accounting rules and partly due to the terribly inaccurate estimates most investors conjure out of thin air when guessing future growth rates. Regardless, it’s something you should know by heart.
The P/E Ratio — What It Is and Why Investors Care
Before you can take advantage of the p/e ratio in your own investing activities, you need to understand what it is. Simply put, the p/e ratio is the price an investor is paying for $1 of a company’s earnings or profit. In other words, if a company is reporting basic or diluted earnings per share of $2 and the stock is selling for $20 per share, the p/e ratio is 10 ($20 per share divided by $2 earnings per share = 10 p/e).
Confused yet? No need to be. Most stock-quote systems such as Yahoo! Finance will automatically figure the price-to-earnings ratio for you.
Once you have the magic number, it’s time you begin to wield its power. It can help you differentiate between a less-than-perfect stock that is selling at a high price because it is the latest hot-pick on Wall Street. and a great company which may have fallen out of favor and is selling for a fraction of what it is truly worth.
First, you have to understand that different industries have different p/e ratio ranges that are considered normal. For example, technology companies may sell at an average p/e ratio of 20, while textile manufacturers may only trade at an average p/e ratio of 8. There are exceptions, but for the most part, these variances between sectors are perfectly acceptable. They arise out of different expectations for different businesses; technology companies usually sell at higher valuations because they have much higher growth rates and earn higher returns on equity. while a textile mill, subject to dismal profit margins and low growth prospects, might trade at a much smaller multiple. Interestingly, since the Great Recession of 2008, technology stocks have traded at lower price-to-earnings ratios than many other types of businesses, such as consumer staples. because investors are frightened and want to own companies that manufacture products that everyone needs, such as dish soap and laundry detergent.
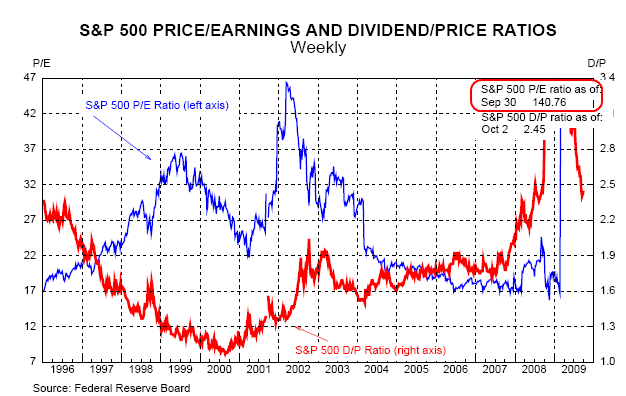
One way to know when a sector is overpriced is when the average p/e ratio of all of the companies in the industry climbs far above the historical average. (A sector is a group of companies in a particular line of business; e.g. pharmaceuticals, advertising, utilities, etc.) This could spell trouble. We saw the repercussions of just such gross-over pricing in the technology crash following the dot-com frenzy of the late 1990’s and, later, in the stocks of companies linked to real estate. Investors could have avoided huge declines in their stocks had they sold when they realized entire industries was dangerously expensive relative to normalized earnings. Graham was fond of averaging profit per share for the past seven years to balance out highs and lows in the economy.

Using the P/E Ratio for Comparison of Companies in the Same Industry
In addition to helping you determine which industries and sectors are over / under priced, you can use the p/e ratio to compare the prices of companies in the same sector. For example, if company ABC and XYZ are both selling for $50 a share, one might be far more expensive than the other depending upon the underlying profits and growth rates of each stock.
Company ABC may have reported earnings of $10 per share, while company XYZ has reported earnings of $20 per share. Each is selling on the stock market for $50. What does this mean? Company ABC has a price-to-earnings ratio of 5, while Company XYZ has a p/e ratio of 2 1/2. This means company XYZ is much cheaper on a relative basis. For every share purchased, the investor is getting $20 of earnings as opposed to $10 in earnings from ABC. All else being equal, an intelligent investor should opt to purchase shares of XYZ. For the exact same price ($50), he is getting twice the earning power. This concept is known as the earnings yield. It is the inverse of the p/e ratio. There are several ways to use earnings yield as a value investing strategy. especially when comparing earnings yields to Treasury bond yields .
The Limitations of the P/E Ratio
Remember, just because a stock is cheap doesn’t mean you should buy it. Many investors prefer the PEG Ratio. instead, because it factors in the growth rate. Even better is the dividend adjusted PEG ratio .
If a company’s stock price has fallen, do your research and discover the reasons. Is management honest? Are they losing key customers? Look at insider trading. such as buy or sell orders. Is the Board of Directors buying stock in the company? If the stock has fallen, is the weakness across the entire sector, industry, or economy, or is it caused by firm-specific bad news. Is the company going into a permanent state of decline? After all, Eastman Kodak looked cheap 10 years ago. but now it is near penny stock territory.


