Trading with Speed lines (Speed Resistance Lines)
Post on: 16 Март, 2015 No Comment

Speed Resistance Lines or Speed lines for short is a trading concept that was developed by the late Edson Gould who was one of the pioneers as a stock market technician. In 1977, Forbes Magazine described Gould as the dean of technicians.
The speed resistance line concept is based upon the theory that trends can be divided into three equal parts and makes use of trend lines to divide the underlying trend which are then projected into the future to act as support and resistance lines.
Although this method is quite reliable and tends to act better than plotting trend lines based on current price action, many traders do not make use of speed lines. Adding this technical analysis to your existing trading arsenal can greatly help the trader understand price action much better and especially alert the trader of any impending support and resistance levels.
What are Speed Resistance Lines
They are nothing but projected trend lines taken from the peak to the bottom (or bottom to the peak) of a previous trend which is then divided into 1/3rd and 2/3rd retracements.
Unlike the more commonly used trend lines which are used to connect consecutive peaks or troughs in a trend, Speed resistance lines tend to cut through price action. Thus a speed resistance line acts as both support and resistance.
The primary purpose of the speed resistance lines is to ascertain if the prevailing trend will continue or reverse, thereby alerting the trader of either a potential retracement or indeed a reversal.
Plotting Speed resistance lines
In order to plot the speed resistance line:
- Switch to a daily or higher time frame chart and compress the chart so the prevailing trends are easy to spot
- In an uptrend, plot the distance between the bottom and the peak with two vertical lines respectively
- The vertical line near the peak should be divided to 1/3. 2/3 and 1/2
- Plot three trend lines where each of them cuts through the three points
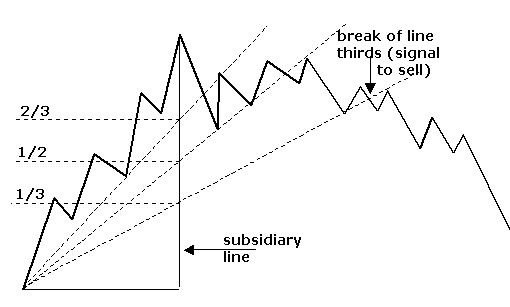
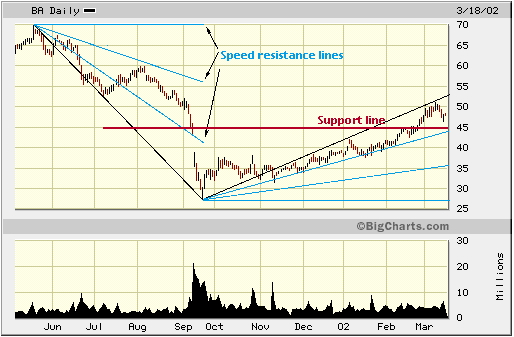
The two charts below illustrate how the speed resistance lines are constructed to measure both uptrends and downtrends.

Fig 1: Speed Resistance Lines Uptrend
Fig 2: Speed Resistance Lines Downtrend
Interpreting Speed Resistance Lines
Now that we have plotted the speed resistance lines, the next question that comes to mind is how to use them. Firstly, remember that Speed Resistance Lines is not a trading method but is used to remind the trader of any important support and resistance levels (especially when price action is close to any of the trend lines).
The general rule using speed resistance lines are:
In an uptrend: If price drops through the first Speed Resistance Line (SR1) it tends to act as resistance, thus price generally goes on to test the second Speed Resistance Line (SR2). Retracements usually tend to happen around this region and it is also possible that prices breaks this SR2 line ever so often only to move back and continue on with the uptrend. Lastly, when price action breaks through SR2 which now forms a resistance, while the third speed resistance line acts as support, it indicates a weakening trend. However, that is not to say that price will continue to drop further. It is quite possible for price to reverse in this zone (between SR2 SR3) to continue back on its uptrend. But in the event price breaks through SR3, it indicates at a change of trend.
This can be clearly seen in Figure 1 where price breaking through SR3 continued moving downwards.
In a downtrend: In a downtrend the first immediate speed resistance line acts as the toughest resistance line and a break of this line hints at an early upward trend being resumed. However, this cannot be confirmed well until SR3 is broken. One can often find that the last leg before resuming the uptrend usually has a push from the region between SR2 and SR3.
Speed Resistance Lines Notes
To conclude, the speed resistance lines are a great yet simple way to remind oneself about key support and resistance levels. These lines can be plotted on any time frame and works in almost all markets. The most important speed resistance lines are those based on higher time frames. So the SR lines plotted off a monthly chart carry more weight than SR lines plotted off a daily chart.
In order to plot the region that we are measuring, traders can use the fibonacci tool with custom levels of 0.33, 0.5 and 0.66. On the daily charts, traders can base their trade entries based off important candlestick patterns and use the SR lines for booking profits.


