Top 10 Financial ETFs
Post on: 29 Март, 2015 No Comment

Exclusive FREE Report: Jim Cramer’s Best Stocks for 2015.
Our goal in this profile is to help investors wade through the many competing ETF offerings available. Using our long experience as an ETF publication, we can help select those ETFs that matter and may not be repetitive. The result is a more manageable list of issues from which to choose.
There are currently nearly 40 ETFs oriented to the financial sector. The following analysis features our top selections of ETFs. We believe these constitute the best index-based offerings individuals and financial advisors may utilize.
ETFs are based on indexes tied to well-known index providers including Russell, S&P, Barclays, MSCI, Dow Jones and so forth. Also included are some so-called enhanced indexes that attempt to achieve better performance through more active management of the index.
The financial sector has been at the epicenter of economic and stock market woes during the 2008-2011 (and perhaps beyond) periods owing primarily to the housing bubble bust and collapse of security products created to accommodate rising real estate prices. As investors know this collapse has led to ongoing bailouts and bankruptcies. Some believe the sector is on the mend but current data don’t necessarily support this view. Uncertainty as to a positive resolution of these issues remains a drag on markets overall and this sector in particular.
There has never been a bull market when financials were not a participant in any overall rally. As a consequence, its important investors pay close attention to the behavior of the sector whether from general news and price action. Doing so would offer important clues as to market health and overall future conditions.
One thing you’ll note with charts posted are the similarities in trends and performance from one to another. This isn’t a coincidence given overall index constituent similarities. Further, the easy money policies of the Fed during the period covered have made performance results hardly distinguishable one from another.
There are catchall sectors like XLF covering the entire sector and individual areas like banking, brokering and insurance for investors wishing to isolate and target their focus.
We rank the top 10 ETF by our proprietary stars system as outlined below. If an ETF you’re interested in is not included but you’d like to know a ranking send an inquiry to support@ETFDigest.com and we’ll attempt to satisfy your interest.
Strong established linked index
Excellent consistent performance and index tracking
Low fee structure
Strong portfolio suitability
Excellent liquidity
Established linked index even if enhanced
Fees higher than average
Portfolio suitability would need more active trading
Average to below average liquidity
Index is new
Issue is new and needs seasoning
Fees are high
Portfolio suitability also needs seasoning
Liquidity below average
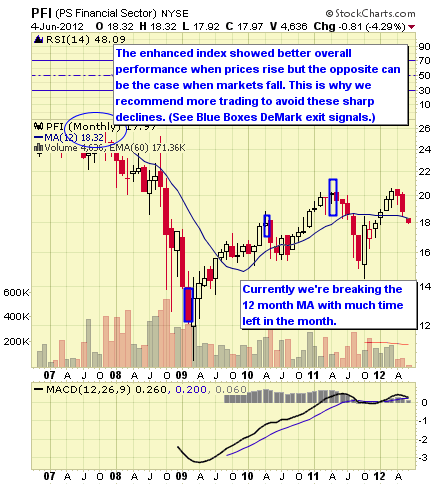
We feature a technical view of conditions from monthly chart views which we believe adds value to the process. Simplistically, we recommend longer-term investors stay on the right side of the 12 month simple moving average. When prices are above the moving average, stay long, and when below remain in cash or short. Some more interested in a fundamental approach may not care so much about technical issues preferring instead to buy when prices are perceived as low and sell for other reasons when high; but, this is not our approach. Premium members to the ETF Digest receive added signals when markets become extended such as DeMark triggers to exit overbought/oversold conditions.
For traders and investors wishing to hedge, leveraged and inverse issues are available to utilize from ProShares and Direxion and where available these are noted.
#1: SPDR Financial Select Sector ETF (XLF)
XLF tracks the overall S&P Financial Select Sector Index. The fund was launched in December 1998 and is the granddaddy of the sector. The expense ratio is .20%. AUM (Assets under Management) exceeds $4.2 billion and average daily trading volume is 117M shares. There are popular leveraged inverse/long ETFs available through ProShares, Direxion and options which may enhance daily trading volume. As of late November 2011the annual dividend yield was 1.71% and YTD performance for the same period -35.41% reflecting previously mentioned financial uncertainties. (Note the heavier weighting of BRK.B, WFC and JPM as index constituents.)
XLF Top Ten Holdings & Weightings
Data as of November, 2011
- Berkshire Hathaway Inc B (BRK.B): 8.55% Wells Fargo & Co (WFC): 8.54% JPMorgan Chase & Co (JPM): 8.45% Citigroup Inc (C): 5.75% Bank of America Corporation (BAC): 4.32% The Goldman Sachs Group Inc (GS): 3.45% American Express Co (AXP): 3.28% U.S. Bancorp (USB): 3.07% Simon Property Group Inc (SPG): 2.35% MetLife Inc (MET): 2.32%
#2: Vanguard Financials ETF (VFH)
VFH tracks the MSCI US Investable Market Financials 25/50 Index. The fund was launched in January 2004. The expense ratio is .25%. AUM equal $485M with average daily trading volume of less than 142K shares. As of late November 2011the annual dividend yield was 2.12% and YTD performance was -23.00%. The mix of constituent assets within the index primarily account for the difference in performance via XLF. This should put VFH atop the leader board but it’s also understood component mix can vary and indeterminately affect performance.
VFH Top Ten Holdings & Weightings
Data as of November, 2011
- JPMorgan Chase & Co (JPM): 7.08% Wells Fargo & Co (WFC): 6.09% Citigroup Inc (C): 5.25% Bank of America Corporation (BAC): 4.81% Berkshire Hathaway Inc B (BRK.B): 3.02% The Goldman Sachs Group Inc (GS): 2.86% American Express Co (AXP): 2.43% U.S. Bancorp (USB): 2.13% MetLife Inc (MET): 2.01% Simon Property Group Inc (SPG): 1.48%


