The Consumer Price Index Spending and Inflation
Post on: 23 Апрель, 2015 No Comment

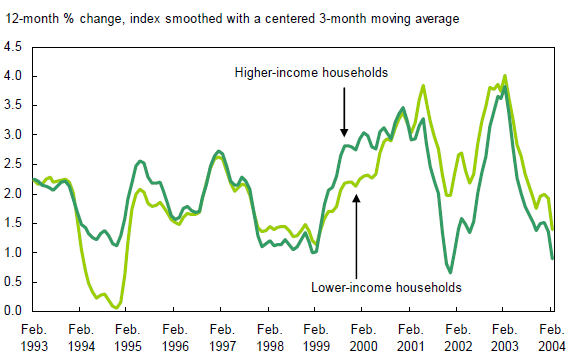
In speaking with REALTOR® members, I often hear a complaint that the government’s inflation statistics do not reflect reality. Recent data show that the inflation rate for consumer prices has increased about 2 percent above a year ago, but many members disagree with that assessment. In this article we’ll see how it’s possible that both members making this observation and the government data are correct.
Inflation What are we measuring?
Anytime you are using a measurement tool, you have to know what the tool is measuring. Real estate agents educate clients regularly on this aspect of measurement. What if a client questions your suggested list or offer price noting that prices are rising or falling 10 percent based on a national news story they heard recently? How do you respond? In all likelihood you point out the differences between national and local market conditions. For example, while the national job market may be humming along, your job market may be searing hot as a result of several new tech start-ups and that will be reflected in local home prices that will be rising faster than national prices.
What does the Consumer Price Index measure?
The Consumer Price Index (CPI) measures prices for the spending of all urban consumers. There are other indexes for different subgroups, but this is the measure you will hear about in the news most often. The Bureau of Labor Statistics (BLS) surveys households asking them to list the things they buy on a regular basis and gathers this information into a market basket reflective of the typical or average household consumer. The BLS tracks changes in prices of this “market basket” of goods and services. This is a very good approximation of the overall change in prices, but it is unlikely to reflect the pattern of increase faced by any individual. Let’s look at the market basket to see why.
What does the typical consumer buy?
Below is a pie chart of the relative importance of spending categories in the CPI which is roughly akin to the share of spending. How closely does the market basket of goods reflect your spending habits?
Breaking this chart down to a table showing a few more detailed categories may illustrate the point.
The table above shows that the market basket weights rent of primary residence at just less than 7 percent of spending while owners’ equivalent rent of primary residences is weighted at about 22 percent. From this illustration you can see that as the market basket tries to capture the spending habits of all urban consumers it cannot be an exact match for every individual’s spending because most people either own OR rent their primary residence.
How does the market basket of goods reflect your spending habits? How does it reflect the spending of your potential clients? Are there particular commodities or services that make up more of your budget? What is happening to the prices of goods and services you actually consume? Have you looked for a personal inflation rate calculator to see what your inflation rate might be?
3A%2F%2F1.gravatar.com%2Favatar%2Fad516503a11cd5ca435acc9bb6523536%3Fs%3D100&r=G /%
Danielle Hale, Director of Housing Statistics
As a Research Economist at NAR, Danielle studies tax issues, the wealth impact of home ownership, and different measures of home prices.


