Stochastic Indicato Stock Market Trading
Post on: 16 Март, 2015 No Comment

In this article I will explain the Stochastics indicators and how best to use it, but also when not to use it. Created by George C. Lane in the late 1950’s this gained popular appeal through its ability to visible show if a stock is overbought or oversold.
Stochastics is an oscillating indicator which means it oscillates between the 0 and 100 mark.
Stock is Overbought: the line is above the 80 mark = a stock price is at the upper range of its Movement, and “could” be due for a downturn
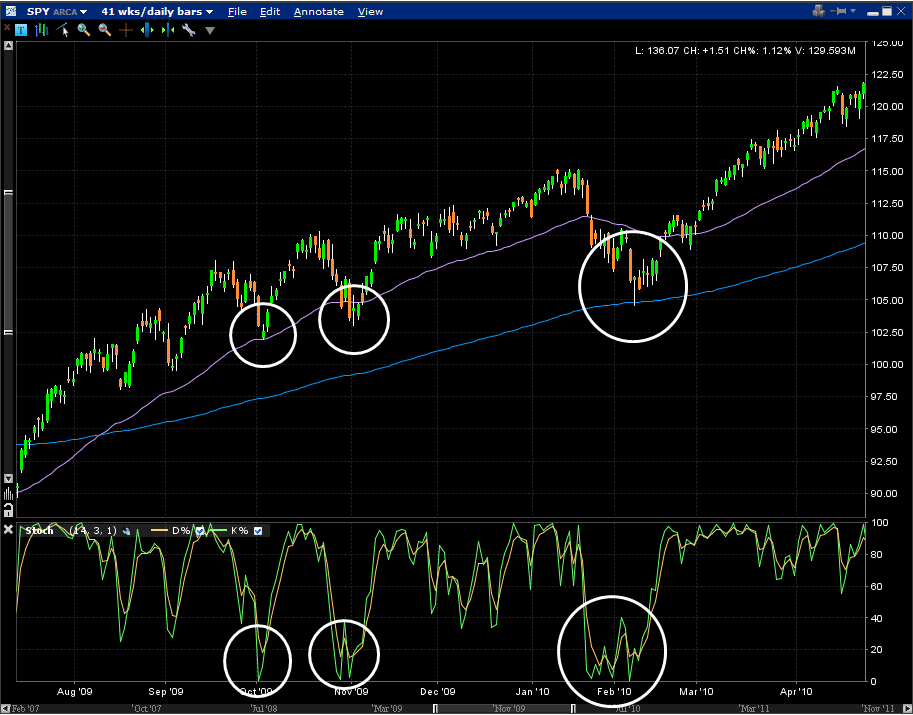
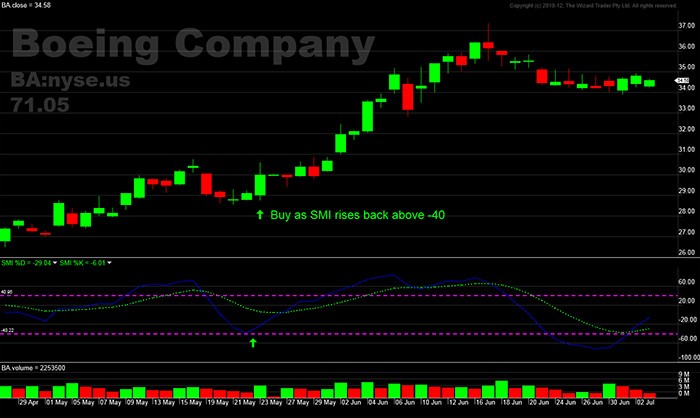
Stock is Oversold. the line is below the 20 mark = a stock price is oversold and may be due for an upturn in its price movement.
The equation for the calculation is not complex, yet we need not discuss the details here, your stock charting package will explain this in all its gory detail.
Suffice to say there are 2 main types of setting, the Fast Stochastic and the Slow stochastic.
Fast Stochastics. use shorter Time Periods, and Shorter Averages – this creates more fluctuations but conversely also more false alarms
Slow Stochastics. use longer time periods and longer average periods – this creates a smoother flow and gives the ability to see trends clearer, the drawback is the Indicator lags price and is less responsive.
Please be careful with this indicator
the following points must be understood when using Stochastic indicators.

- Using Slow Stochastics settings on most stock charting packages does not provide enough information whether trading Intraday, or on a longer timeframe
- Stochastics have serious limitations, and has been superseded by many more sophisticated tools, TSV, Money Stream for example.
- Stochastics works well on a very short time frame to save you a few points on your buy & sell price. I usually use Stochastics (Slow) when I am about to trade, to squeeze out the very best price in the given time period. I Sell the stock when overbought and buy the stock when oversold.
- Stochastics work best when there are no strong fluctuations or Volatility in the market or in the particular stock.
- Always use Stochastics with other indicators not alone. Stochastics uses the Price Open, High, Low and Close for the period, so can be used well in conjunction with RSI, which uses only Close Price as the input.
- Back test a stochastic setting to see if it fits the past. Adjust the Values to fit the stock.
- If it does not tell you anything, do not use it.
Here you can see Smith & Wesson Holdings Corp, the gun maker. I made 20% in 2 days on this stock in February 2009, so I will use it to demonstrate Stochastics.
- November to February, the Highest Highs of the stock are slowly declining
- Fast Stochastics Settings (14,8,8) are showing a slight divergence, but also a lot of False alerts
- Slow Stochastics (34,8,8) show a much smoother lines, and stronger divergence, where the stock for this whole period does not reach an oversold state.
- Moving Averages (10 & 20) did a really good job indicating when the ideal time to buy was. This using Stochastics with other indicators is important.
If you like to use Stochastics use them with care. Follow the guidelines above and use with other indicators.
Divergences are your friends with practically all indicators. Remember when an indicator starts to Diverge with the Trend of the price, then this is an early warning signal that the underlying factors behind a stock price are changing and it may not be visible in the price pattern.
Learn Stock Market Trading and Investing with FREE Education and Training on Stock Screening, Stock Charts, Candlesticks, Technical Analysis & Fundamental Analysis and Stock Chart Indicators, Trading Academy Membership is free register here.


