MACD (Moving Average Convergence Divergence)
Post on: 16 Март, 2015 No Comment

MACD (Moving Average Convergence Divergence) is an indicator of stock market technical analysis. He analyzes the amplitude difference of two exponential averages of different period applied to a new exponential averaging.
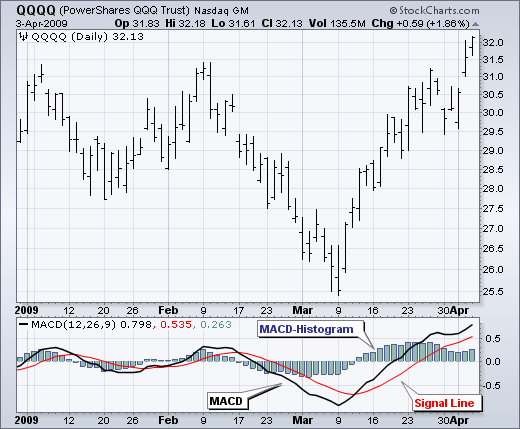
This indicator has three components: the MACD, Signal and histogram. The first component, MACD is the difference between two simple moving averages of different lengths. The most common is the difference between the moving average of 12 periods and of 26 periods. The first average is a fast average is more sensitive to price movements in the short term and the second is a medium-term average. These values can be changed, although it is usually used as parameters averages 12 and 26 periods. The third component is the histogram, which corresponds to the difference between the MACD and the signal and serves as an indicator to start or close a position.
The exponential moving average of the difference is known as signal line.
For why does it serve?
Like other indicators based on moving averages, your utility is to provide signal of buy and sale when the market it is in trend.
Allow to find divergences between the oscillator and the price chart, and also mark moments or overbought or oversold levels.
How is it used?
The default values of the periods of the averages that are used for the calculation are 12 for EMA quick, 26 for EMA slow and 9 for the exponential average of difference.
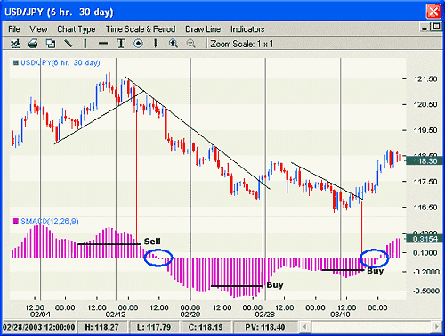
The crossing of the two lines is what makes the purchases and sales. If the MACD crosses the signal line upwards, it is possible to start an upward movement and activates a purchase.
If the MACD crosses the signal line downwards, increasing the possibility of the beginning of a downward movement and activates a sale.
As analysis of differences it is necessary to observe the gyre in MACD, if they coincide with ends successive with the graph of prices.
The formula of the MACD is:
MACD = EMA (12) EMA (26), where EMA is exponential moving average.

Signal formula is:
Signal = EMA (9, MACD)
The formula of the histogram is:
Histogram = MACD Signal
Tips of Trading:
Try to use as parameters the numbers obtained across the series of Fibonacci (1, 2, 3, 5, 8,13, 21, 34, …)
Average exponential short =13, average exponential long = 21, average exponential of the difference = 8


