Is Market Volatility Sending a Warning
Post on: 18 Август, 2015 No Comment

About
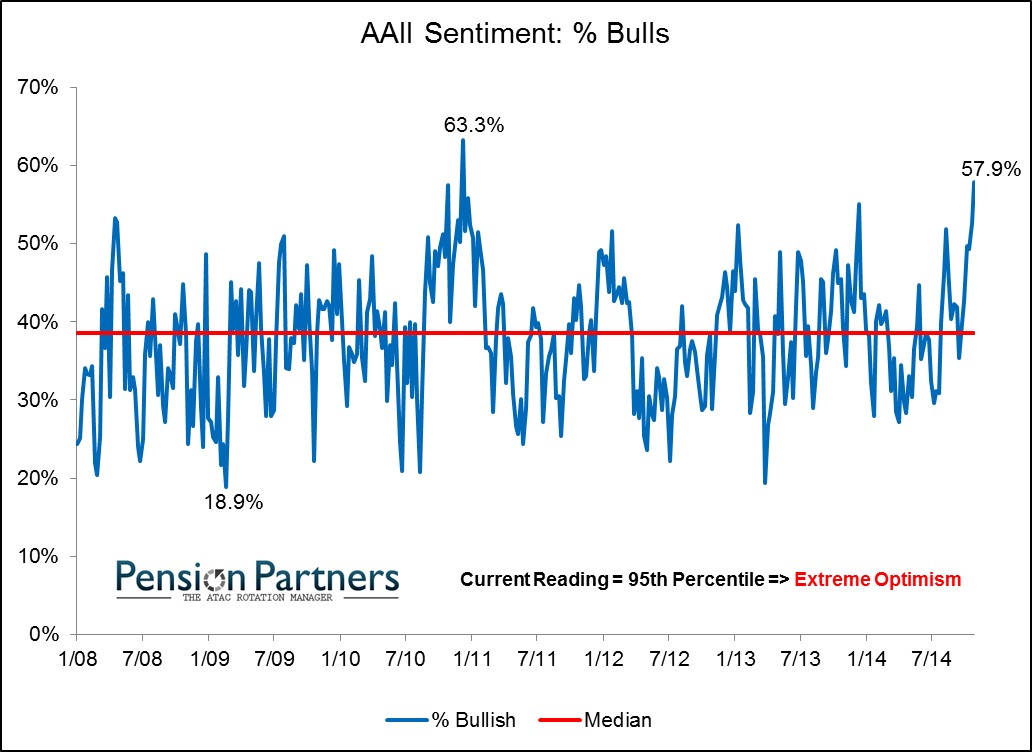
The widely-referenced Chicago Board Options Exchange Volatility Index ($VIX ), which measures the volatility of S&P 500 index options, recently fell to lows not seen since the heady bull market days of July 2007, just before the market hit its multiyear high three months later.
While common sense suggests that rising confidence and declining volatility are positives for the stock market, the VIX often acts as a contrarian indicator: the VIX tends to drop to its lows at market tops.
If this historical correlation continues to hold true, then the VIX might be warning us now that the market is topping out.
Up Could Mean Down
Why would this be so? Sometimes markets rise when nervous investors who have waited out the rally leave the sideline and buy into the market. When all the potential investors have jumped in, then complacency sets in — a condition reflected by a low VIX. At that point, the market is ripe for a decline.
Alternatively, when the VIX rockets up in a spike of fear and uncertainty, that generally marks the market bottom.
More subtly, when the VIX gyrates up and down, that suggests market participants are veering uncertainly between bullish and bearish sentiment. This reflects the wall of worry which tends to accompany steadily rising bull market rallies.
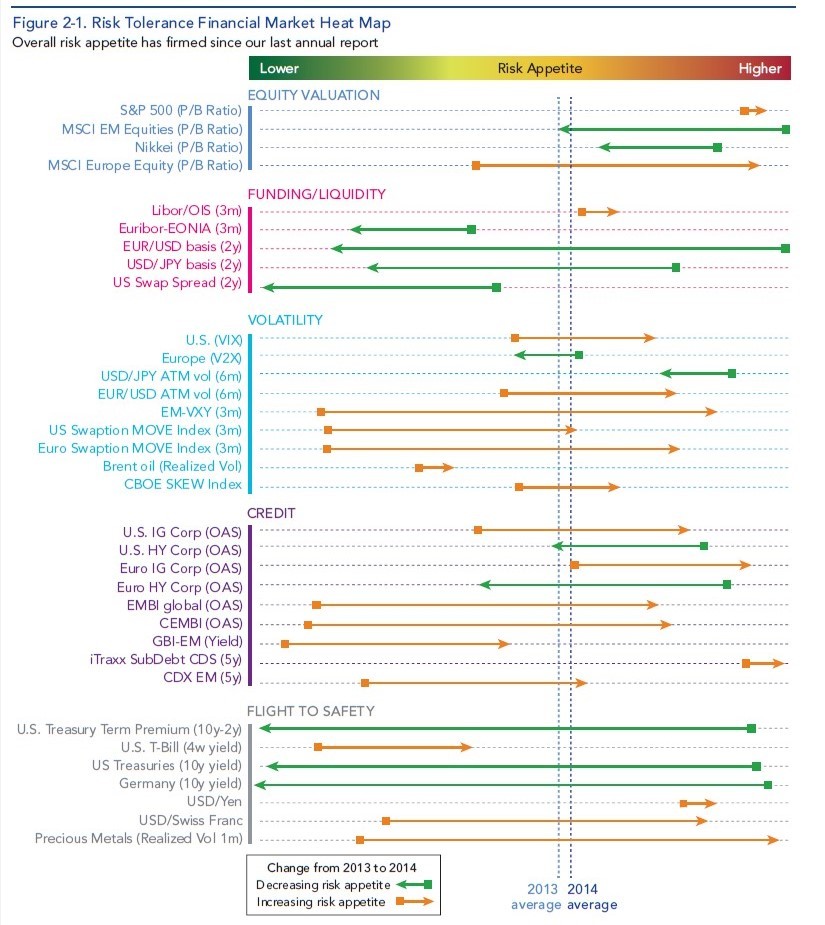
As noted, the VIX index is based on the option prices of S&P 500 stock index. When investors are nervous and fearful of a decline, they bid up the price of protection against a decline: a put option. When participants are confident and complacent, the demand for protection (puts) falls.
Many money managers use the VIX as a contrarian indicator; others parse the related put-call ratio for evidence of market peaks and valleys. When investors and speculators buy more calls (bets the market will rise) than puts (bets the market will decline), that reflects bullish sentiment. At extremes, when few feel the need to protect their portfolios with puts, that acts like the VIX: a warning of extreme complacency that often marks a top.
Investors can also check the put-call ratio on an intraday basis via the Chicago Board of Exchange (CBOE) website. Another popular measure of put-call sentiment is the ISEE Equities indicator.
The VIX and the Crisis
Let’s look at the VIX over the past few years to see how it performed at the market top in October 2007 and at the market bottom in March 2009.
From a low in April 2007, volatility rose in the summer of 2007 before falling to a trough at the October peak (roughly S&P 500 1,565). This increase in volatility before the market top could be interpreted as a wall of worry the market climbed to reach its zenith in early October.

But volatility continued gyrating through the winter of 2007 and spring of 2008, reflecting of rising investor unease. The VIX dropped in 2008, but not back down to the levels of early 2007. One spike in summer 2008 telegraphed increasing anxiety, but this episode passed and the VIX fell back to the complacent 20 level in August 2008.
Then the unexpected happened: Lehman Brothers declared bankruptcy on September 15, 2008. The VIX shot up to multiyear highs, reaching 80 in October before plunging 30 points to 50 in a brief relief-rally, and then spiking up to 80 once again in December as the financial contagion spread around the globe.
Yet these spikes did not mark the final market bottom, showing that no one indicator reliably rings the bell at the exact top or bottom. But the VIX did spike up in January-February of 2009, a pattern which culminated in the final March 9 low of the S&P 500 at 667.
As the market started rallying, the VIX fell-and continued declining for the next year, spiking up during the market retracements in July and November 2009 and February 2010. These declines and spikes show that the inverse relationship between the VIX and the stock market continues to hold: spikes in the VIX accompany market bottoms.
Back to the Future
Now we come to the present, and once again the VIX has settled to multiyear lows around 16. This complacency worries some bulls, as a low VIX has often been a warning that the market is ripe for a correction. More subtly, the VIX has begun to gyrate in the past few weeks, spiking up to 19 and then falling just as rapidly back to the 16 level.
These fluctuations suggest market participants are again uncertain and are swinging abruptly from bullish to bearish and then back to bullish. It is a truism that the stock market does not like uncertainty, and the VIX is displaying signs of just such uncertainty.
There are plenty of bricks in this wall of worry: the Greek debt crisis, rising wholesale prices, and the real estate bubble in China. Will the market continue climbing? Ironically, a modestly rising VIX would be a bullish indicator that participants are still overcoming their doubts and entering the market. But if the VIX continues to bounce along at multiyear lows, that may be a warning that complacency and confidence have reached extremes which in the past have marked market tops.


