Introducing Parabolic SAR The FX View
Post on: 16 Март, 2015 No Comment

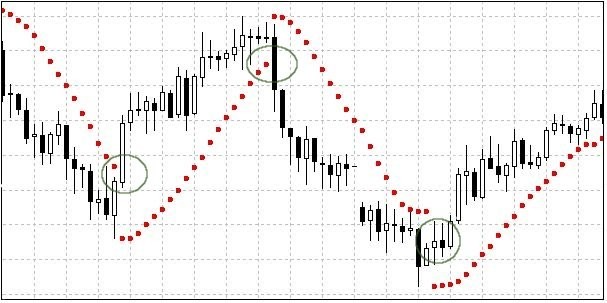
Candlestick Chart with Parabolic SAR
The parabolic SAR, was first developed by Welles Wilder is price-and-time based trading system. Wilder originally called the system he developed the Parabolic Time/Price System. The SAR in the name stands for Stop and Reserve, which is the indicator used in system. The indicator falls below price action when prices are rising and rises above price action when prices are falling. This is where the SAR comes in, the indicator stops and reserves when price trends reserve and break through or below the indicator.
The system was introduced in his 1978 book New Concepts in Technical Trading Systems. Wilder introduced a number of other indicators in his book including the RSI, Average True Range (ATR), and the Average Directional Range (ADX). Despite the age of Wilders Indicators they have remained incredibly popular. The parabolic SAR remains a very useful indicator for traders engaging technical analysis and can help a trader determine where to place trailing stops.
Calculating the Parabolic SAR is not particularly easy, thankfully the majority of trading and charting software will calculate the Parabolic SAR for you. This is partly their are different methods for calculating falling and rising parabolic SARs, this makes calculating Parabolic SAR using a Spreadsheet quite difficult.
Interpretation
The Parabolic SAR, follows price action and should be considered a trend following indicator. Once a downtrend reverses and a new trend starts the Parabolic SAR follows the price upwards like a trailing stop. The SAR continues to rise as long as the upwards trend continues. The Parabolic SAR never decreases during an upwards trend and can help you continuously protect your profits. Thus the indicator can work to help you stop lowering your stop-losses, which is can be very tempting. When a upward trend ends and prices start falling the Parabolic SAR will remain above the price, again the indicator follows prices down like a trailing stop. Due to the fact that the Parabolic SAR never rises during a downtrend, thus it can help you protect your profits on short positions.
Adjusting Sensitivity: Step Increments/Acceleration Factor
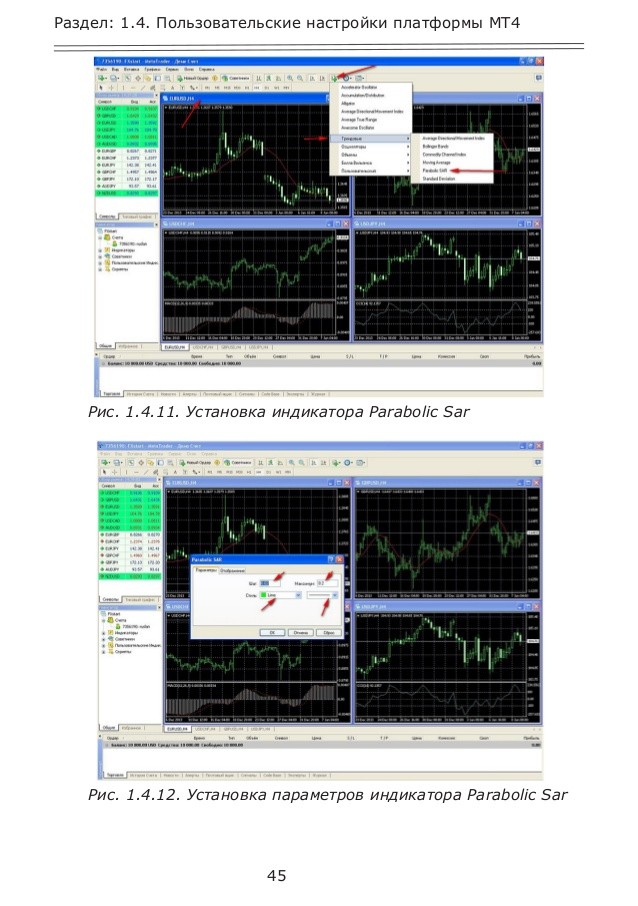
The sensitivity of the Parabolic SAR can be adjusted by altering the Acceleration Factor (AF). The AF is also referred to by some as the Step Increment. The Step or Acceleration Factor acts a multiplier which influences the rate of change of the indicator. The Step increases gradually as the trend extends until it hits its maximum value. The sensitivity of the Parabolic SAR can be decreased by decreasing the step. Lowering the Step will result in the SAR being further away from the price, which makes a reversal much more likely.

The sensitivity of the Parabolic SAR can be increased by increasing the Step or Acceleration Factor (AF), a higher Step will lead to the Parabolic SAR being closer to the price. However if you increase the sensitivity too much, the indicator will reverse very often leading to the indicator producing regular whipsaws.
Adjusting Sensitivity: Maximum Step
The sensitivity of the Parabolic SAR can also be adjusted by changing the Maximum step. The Maximum Step affects the sensitivity of the indicator to a less degree than the Acceleration Factor. A lower maximum step will decrease the sensitivity of the indicator, meaning that price reversals will happen less frequently. While a higher maximum step will increase the sensitivity of the indicator leading more reversals. Again traders need to be careful not to increase the indicators sensitivity too much.
Concluding Thoughts
The Parabolic SAR works best when instruments are trading. According Welles Wilders original research this occurs around 30% of the time. This means that traders need to be careful when using the indicator, as it is prone to produce whipsaws when the instrument in question is not trending. The Parabolic SAR is designed primarily to follow an overriding trend and act as a trailing stop. As with the majority of technical indicators they quality of the signals produced depends on the underlying market and the settings used. Traders have to be particularly careful when using the Parabolic SAR as an indicator, as the wrong settings can lead to frustration and heavy losses. As with many other indicators the Parabolic SAR is often used in conjunction with other technical indicators, with the Parabolic SAR often being used in conjunction with Wilders Average Directional Index .


