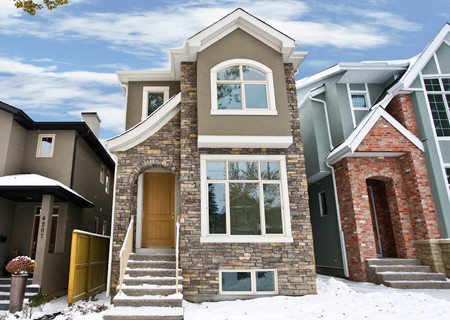
In Calgary home prices are booming and so is the infill business
Post on: 16 Март, 2015 No Comment

What is this?
Sponsored content is written by Global News’ without any editorial influence by the sponsor. If you’d like to learn more.
Interactive: Explore changes in house prices in Calgarys neighbourhoods. Click and drag to zoom and move around, or type an address in the search bar.
The business of tearing down southwest Calgary homes and building new ones is booming – so much so that Calgary realtor Thomas Ferianec couldn’t resist diving in.
“You can make yourself a pretty good living at it,” says Feraniec, who lives in the area.
Nowhere is the pace of residential redevelopment quicker than in the Marda Loop, a collection of neighbourhoods in Calgary’s southwest a 10-minute drive from downtown.
Over the past decade, the area has been transformed by infills – new homes replacing older, postwar bungalows on subdivided lots.
So far this year there’ve been 94 new construction permits issued for the Altadore neighbourhood – almost all of them for detached and semi-detached houses.
The buyers still keep coming
After the city’s post-boom slowdown in 2006, home values have surged, fuelling the areas gentrification in a kind of positive feedback cycle.
“We’ve seen a huge escalation in land values. Ten years ago we had a little bit of infill activity, but it was nothing compared to what it is today,” Ferianec said.
A good return for a developer contracting their own build is a profit of $160,000 on a new home that sells for about $800,000 Ferianec says. Prices are up 78 per cent from 2005. And while sale volume has dropped by almost a quarter in that same time period – to 178 in 2012 from 231 seven years earlier thats largely because developers are running out of old homes to tear down.
“The buyers still keep coming,” he says.
Meantime, the gulf between incomes and house prices is also growing.
Calgary home prices vs. income
The median home costs about four times median household income less than at the housing booms 2007 peak but still enough to put Calgary in “seriously unaffordable” territory, a report from international urban development consultancy Demographia suggests .
Others disagree.
Affordabilty in Calgary “is only slightly under the historical average, despite relatively high home prices,” Desjardins economists said in an Oct. 29 commentary .
High incomes + low rates = oil-powered appetite for housing
One factor keeping houses within reach for many Calgarians: high income growth in a million-person oil-driven city.
Median incomes for non-elderly Calgarian households grew 14 per cent between 2005 and 2011 well above most other Canadian cities.
A second reason is ultra low interest rates. Even after devastating floods rocked southern Alberta in June, the real estate market place rolled along – thanks in part to buyers looking to lock in low interest rates on pre-approved mortgages as the threat of higher rates loomed last summer.
“Not even the worst floods in memory at the end of June appear to have slowed the market’s progression,” an RBC report said in August. “The effect of faster-rising prices has yet to undermine affordability in any material way.
RBC’s own affordability index shows the average home-owning household in Calgary spends more than 35 per cent of its income on shelter – several percentage points higher than lenders are generally comfortable with.
A PriceWaterhouseCoopers report last month echoed an almost reflexive optimism in Calgary’s continued prosperity.
“Calgary marches to a different drum,” it reads.
”It’s tied to energy so it keeps on building.”
Calgarys five fastest-appreciating neighbourhoods
1. Connaught: 83% growth, average 2012 sale price $974,000
2. Altadore: 78% growth, average 2012 sale price $826,000
3. Britannia: 77% growth, average 2012 sale price $2 million
4. Lynx Ridge: 72% growth, average 2012 sale price $1.2 million
5. Cliff Bungalow: 72% growth, average 2012 sale price $783,000
Compares 2005 average sale price for detatched home to 2012 average price. Because of the newness of some of these neighbourhoods, they may not all appear on the map


