How The Baltic Dry Index Predicted 3 Market Crashes Will It Do It Again
Post on: 19 Июль, 2015 No Comment

Summary
- The BDI as a precursor to three different stock market corrections.
- Is it really causation or is it correlation?
- A look at the current level of the index as it hits new lows.
The Baltic Dry Index, usually referred to as the BDI, is making historical lows in recent weeks, almost every week.
The index is a composition of four sub-indexes that follow shipping freight rates. Each of the four sub-indexes follows a different ship size category and the BDI mixes them all together to get a sense of global shipping freight rates.
The index follows dry bulk shipping rates, which represent the trade of various raw materials: iron, cement, copper, etc.
The main argument for looking at the Baltic Dry Index as an economic indicator is that end demand for those raw materials is tightly tied to economic activity. If demand for those raw materials is weak, one of the first places that will be evident is in shipping prices.
The supply of ships is not very flexible, so changes to the index are more likely to be caused by changes in demand.
Lets first look at the three cases where the Baltic Dry Index predicted a stock market crash, as well as a recession.
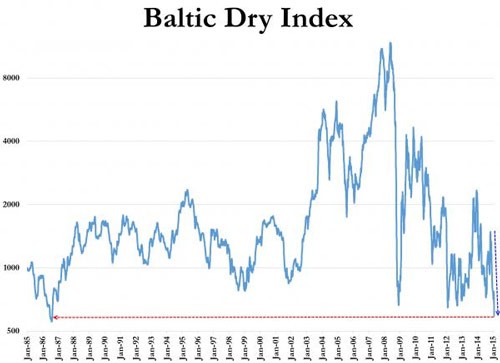
1986 The Baltic Dry Index Hits Its first All-time Low.
In late 1986, the newly formed BDI (which replaced an older index) hit its first all-time low.
Other than predicting the late 80s-early 90s recession itself, the index was a precursor to the 1987 stock market crash.
1999 The Baltic Dry Index Takes a Dive
In 1999, the BDI hit a 12-year low. After a short recovery, it almost hit that low point again two years later. The index was predicting the recession of the early 2000s and the dot-com market crash.
2008 The Sharpest Decline in The History of the BDI
In 2008, the BDI almost hit its all-time low from 1986 in a free fall from around 11,000 points to around 780.
You already know what happened next. The 2008 stock market crash and a long recession that many parts of the global economy is still trying to get out of.
Is It Real Causation?
One of the pitfalls that affects many investors is to confuse correlation and causation. Just because two metrics seem to behave in a certain relationship, doesnt tell us if A caused B or vice versa.
When trying to navigate your portfolio ahead, correctly making the distinction between causation and correlation is crucial.
Without doing so, you can find yourself selling when there is no reason to, or buying when you should be selling.
So lets think critically about the BDI.
Is it the BDI itself that predicts stock market crashes? Is it a magical omen of things to come?

My view is that no. The BDI is not sufficient to determine if a stock market crash is coming or not. That said, the index does tells us many important things about the global economy.
Each and every time the BDI hit its lows, it predicted a real-world recession. That is no surprise as the index follows a fundamental precursor, which is shipping rates. Its very intuitive; as manufacturers see demand for end products start to slow down, they start to wind-down production and inventory, which immediately affects their orders for raw materials.
Manufacturers are the ultimate indicator to follow, because they are the ones that see end demand most closely and have the best sense of where its going.
But does an economic slowdown necessarily bring about a full-blown market crash?
Only if the stock market valuation is not reflecting that coming economic downturn. When these two conditions align, chances are a sharp market correction is around the corner.
2010-2015 The BDI Hits All-time Low, Again
In recent weeks, the BDI has hit an all-time low that is even lower than the 1986 low point. That comes after a few years of depressed prices.
Source: Bloomberg
What does that tell us?
- The global economy, excluding the U.S. is still struggling. Numerous signs for that are the strengthening dollar, the crisis in Russia and Eastern Europe, a slowdown in China, and new uncertainties concerning Greece.
- The U.S. is almost the sole bright spot in the landscape of the global economy, although its starting to be affected by the global turmoil. A strong dollar hits exporters and lower oil prices hit the American oil industry hard.
Looking at stock prices, we are at the peak of a 6-year long bull market, although earnings seem to be at all-time highs as well.
What the BDI might tell us is that the disconnect between the global economys struggle and great American business performance across the board might be coming to an end.
More than that, China could be a significant reason for why the index has taken such a dive, as serious slowdowns on the real-estate market in China and tremendous real estate inventory accumulation are disrupting the imports of steel. cement and other raw materials.
Conclusion
The BDI tells us that a global economic slowdown is well underway. The source of that downturn seems to be outside of the U.S. and is more concentrated in China and the E.U.
The performance of the U.S. economy cant be disconnected from the global economy for too long.
The BDI is a precursor for recessions, not stock market crashes. Its not a sufficient condition to base a decision upon, but its one you cant afford to ignore.
Going forward, this is a time to make sure you know the companies you invest in inside and out, and make sure end demand for their products is bound for continued growth and success despite overall headwinds.


