Future Stock Market Returns PriceEarnings Ratios as a LongTerm Predictive Tool
Post on: 16 Март, 2015 No Comment

As part of gathering the data needed to go beyond net worth. Ive shown ways to track find your personal savings rate by tracking your current spending with your current after-tax income. For now, Im skipping ahead to estimating your portfolios long-term investment returns.
There are a lot of ways to estimate future stock returns. Youve probably heard of the P/E ratio. which is usually the price divided by last years earnings. This is one measure of value. Here is a plot of historical values of the inflation-adjusted S&P 500 index, along with its annual earnings (source ).
Historical Price & Earnings Separately
Historical P/E Ratio
As you can see, there is a lot of volatility in P/E ratio. The P/E 10 ratio is the share price divided by the average earnings over the last 10 years. By taking a long-term average, you smooth out the noise and bumps.
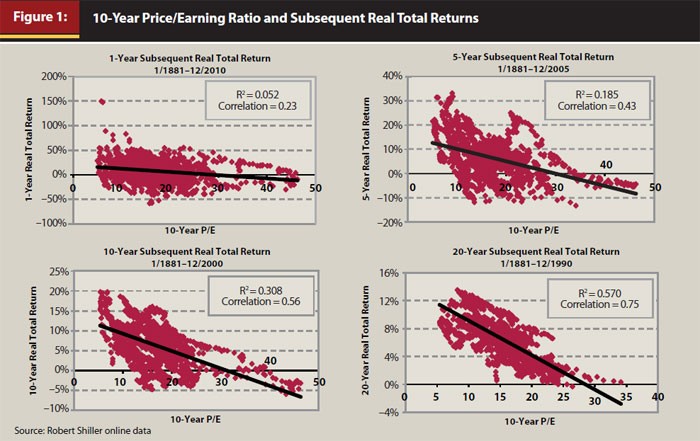
Professor Robert Shiller of Yale University, which provided the above data as well, spoke about the usefulness of this ratio in his book Irrational Exuberance. and provided the data for the following chart. The x-axis shows the real P/E 10 of the S&P Composite Stock Price Index (inflation adjusted price divided by the prior 10-year mean of inflation-adjusted earnings). The y-axis shows the geometric average real annual return of the same index, reinvesting dividends, and selling 20 years later.
Price-Earnings Ratios as a Predictor of Twenty-Year Returns
You can definitely see the relationship that a higher P/E10 usually leads to a lower future return. However, there is still a great deal of scatter for any given P/E10 ratio.
What about today? As of June 2, 2010 the P/E10 is 19.99 with the S&P 500 index at around 1,098. Historical average is about 15. Back in March 2009 when everything was looking bleak, the P/E10 was 13.32. (P/E10 is also referred to as Cyclically Adjusted Price Earnings (CAPE) ratio.)
The Early Retirement Planning Insights website provides a calculator that forecasts future returns based on the current value of P/E 10, again using historical returns. Im not sure exactly how they did all the regression. Heres their return forecast for a P/E 10 ratio of 20.
Future Returns Prediction (P/E10 = 20)
For a 20-year forecast, it shows an average outlook of 4% returns, on a real (after-inflation) basis. Of course, the range indicates that the actual returns could look much worse. As the time-horizon lengthens, the range gets smaller due to the phenomenon of reversion to the mean. Kind of scary to look 60 years ahead!
Warnings
To me, this stuff is useful as a general Big Picture planning tool, not as a short-term trading tool. These are just predictions based on the past, which is often the best we can do, but still far from perfect. Many people use P/E10 as a tool for market timing, shifting their asset allocation as it rises and falls. Shiller himself states that his plot above:
confirms that long-term investors—investors who commit their money to an investment for ten full years—did do well when prices were low relative to earnings at the beginning of the ten years. Long-term investors would be well advised, individually, to lower their exposure to the stock market when it is high, as it has been recently, and get into the market when it is low.
That may be true, but market timing systems can really test an investors faith when they seem to be wrong for a long period of time. On a personal basis, Id probably limit any asset allocation moves if any to if the P/E10 ratio moved to an extreme, for example dropped below 10 or above 25.


