Divergences and Hidden Divergences Traders Laboratory
Post on: 16 Март, 2015 No Comment

Divergences and Hidden Divergences
Divergences between indicator readings and actual price activity allow traders to identify situations where trending moves are likely to complete. This is valuable information for contrarian traders looking to “buy low, and sell high” as evidence of price divergence is often considered a leading indicator of what is likely to happen next in the market. Divergences occur when indicators fail to confirm higher highs (in an uptrend) or lower lows (in a downtrend). Some of the studies most commonly used to identify price divergences include the MACD, RSI, Slow Stochastic, CCI, etc. Here, we will look at some of the ways changes in momentum present themselves, as well as the differences seen in traditional and “hidden” divergences.
Classic Divergences
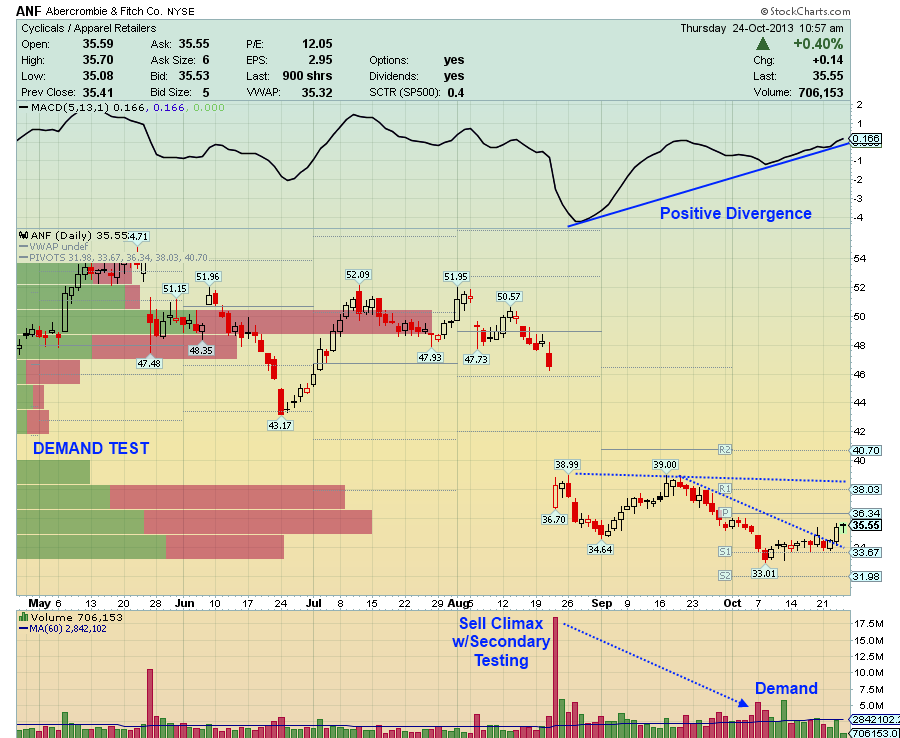
The type of divergence most typically identified is the traditional, or “classic,” divergence, which is an early indication of trend reversals. Bearish divergences occur in uptrends, as indicator readings do not match the higher highs in the market’s valuation. Bullish divergences occur in downtrends, as indicator readings start to rise even though price activity is making lower lows. Classic divergences suggest that a bottom or top might be forming in the market even before the actual price activity has reversed through important support or resistance levels. The first charted example shows the basic structure of a classic divergence. Note the differences between price momentum and the changing direction of the underlying indicator. The second charted example shows the bullish and bearish scenarios in a live chart.
Hidden Divergences
A twist on the divergence scenario can be seen in the “hidden” divergence, which is actually a continuation pattern and can, in many cases, be more effective in predicting future price movements. Similar to the classic divergence, hidden divergences are seen when prices fail to match the activity in the chart indicator. In a bullish hidden divergence the following requirements must be met. The third charted example shows the structural formation:
● Price activity is characterized as an uptrend
● Prices make a higher low
● Indicator reading shows a lower low
In a bearish hidden divergence, the opposite characteristics are seen. The fourth charted example shows the structural formation:
● Price activity is characterized as a downtrend
● Prices make a lower high
● Indicator reading shows a higher high
Hidden divergences are primarily useful for trend traders, as the occurence of this pattern signals that prices have made a corrective retracement in a larger trend — and that the trend is ready to resume. The main benefit of trading with hidden divergences is that the majority of the market’s momentum is on your side, as you are trading in the same direction as the larger trend. This is a key difference between the hidden divergence and the classic divergence, and one that many new traders miss when looking to implement these strategies. The occurrence of a hidden divergence can also act as a confirmation that the original trend is still valid.
Chart Examples with Hidden Divergences

The next charted examples show bullish (5) and bearish (6) hidden divergences with a real-time chart. What is important to remember here is that commonly-used indicators (like the MACD, RSI, or Stochastics) should be viewed for more than just an identification of overbought or oversold conditions. There are important relationships that exist between the indicator reading and the price activity itself. Indicator readings are multi-dimensional and can be used in a variety of different trading strategies. With divergences, we are looking for disagreements between specific aspects of the available information and market reactions.
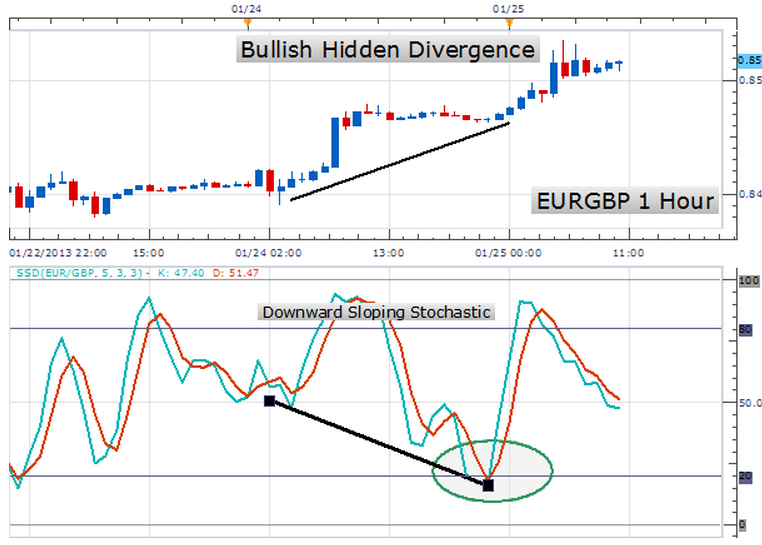
Consider the bullish example in graphic 7. Here, the EUR/GBP has broken out of a tightly consolidated range and despite the upside breakout (and higher lows in price) the Stochastic indicator drops into oversold territory and makes a lower low. Since this type of indicator activity is atypical, attention should be paid. Long positions can be taken here, based on a few different arguments: We can see a bullish crossover in the Stochastics, the indicator is starting to move out of oversold territory, and the hidden bullish divergence suggests that the longer term uptrend is still in place.
In terms of trade structuring, stop losses and profit targets should be based on the initial reasoning behind the bullish argument — the validity of the uptrend. This means the trade should be stopped if there is evidence that uptrend has ended. One of the clearest indications that this is occurring would be if prices dropped below the swing low that preceded the upside breakout. For these reasons, stop losses should be placed below this low. When looking at profit targets, the ultimate assumption is that prices will continue making new highs until one of the initial arguments for the trade becomes invalidated. So, in theory, your ultimate profit target should be above the current trend high. It makes sense, however, to book partial profits just below the previous trend high and then move your stop losses to break even once this target is met. This is because there is still reason to believe the previous trend high could still act as resistance.
The Rubber Band and Catapult Effects
The underlying “power” in the hidden divergence rests on the fact that corrective moves within a larger trend will, at some point, need to catapult themselves back in the appropriate market direction. From a fundamental perspective, this often happens because most of the trend-based profit taking has run its course and the market events that created the trend in the first place still create an accurate representation of the asset’s appropriate market valuation.
From a purely technical perspective, these occurrences show that the indicator reading has generated a larger trend pullback than prices themselves. The indicator will need to revert to its mean in order to stabilize. The necessity for mean reversion often creates a significant “snap-back,” and the added momentum that accompanies these moves is usually enough to bring additional higher highs (in an uptrend) or lower lows (in a downtrend). By definition, this means that the earlier trend is resuming and that the continuation pattern has provided an accurate signal. These trend-supportive changes in momentum are sometimes called the “rubber band” effect, or the “catapult” effect, as they are able to send prices into new regions.
Conclusion: Indicator Readings are for More than Simple Overbought/Oversold Studies
When new traders start constructing positioning ideas with technical analysis, one of the first things we see is the plotting of indicator readings. In most cases, these readings are used to spot places where an asset’s price has become overbought or oversold, and that new positions should be taken in the opposite direction. But when we look at classic and hidden divergences, we can see that indicators can be used in a multitude of different ways. Classic divergences are preferred by contrarian traders, as they suggest a trend is ready to reverse. Hidden divergences offer a different spin on this, and offer trend continuation signals before prices “catapult” themselves in the direction of the underlying price momentum. In both cases, it makes sense to watch your indicator readings in ways that most other traders are missing. Divergences offer one way to get this leg-up on the rest of the market.


