ChartAdvisor for June 27 2014 (SPY IWM QQQ DIA)
Post on: 16 Март, 2015 No Comment

Major U.S. indices moved largely lower over the past week with the exception of the NASDAQ 100, as of Thursday’s close. In another revision to Q1 GDP, the U.S. reported a steep 2.9% drop in annualized GDP during the first quarter. Many economists shrugged off the revision given the solid rebound since then and attributed the dramatic decline to harsh winter weather.
International markets moved largely lower over the past week, as of Thursday’s close. Japan’s Nikkei 225 fell 0.77%; Germany’s DAX 30 fell 1.83%; and Britain’s FTSE 100 fell 1.32%. In Europe, the Markit Purchasing Managers Index (PMI ) fell to 52.8 in June in a sign that the recovery may be losing momentum. In Asia, Japan’s Shinzo Abe unveiled the “third arrow” of his economic plan.
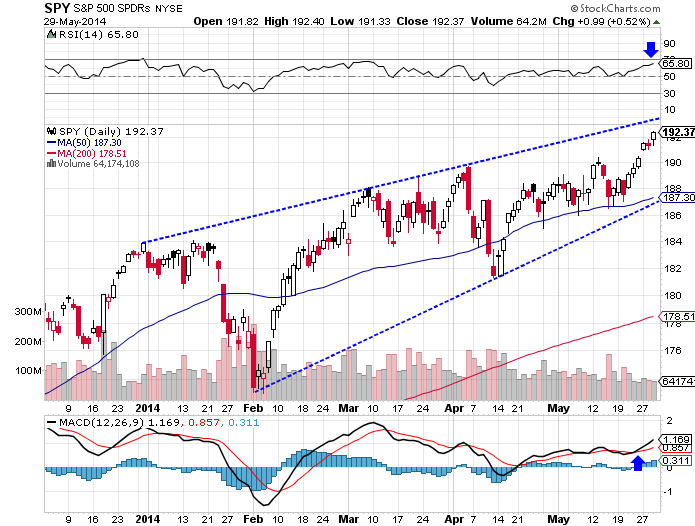
The SPDR S&P 500 ETF (SPY ) fell 0.25% over the past week, as of Thursday’s close. After reaching its R2 resistance at 196.35, the index fell to its R1 resistance and trend line support at 194.05 over the past week. Traders should watch for a retest of its R2 resistance on the upside or a breakdown below its R1 resistance to its pivot point and lower trend line at 189.59. Looking at technical indicators, the RSI appears overbought at 64.86 while the MACD is neutral.
The SPDR Dow Jones Industrial Average ETF (DIA ) fell 0.59% over the past week, as of Thursday’s close. After falling to its lower trend line and R1 resistance at 167.98, the index has been trading sideways near those levels. Traders should watch for a breakout to its R2 resistance at 169.36 or a move below its lower trend line to its 50-day moving average at 165.82. Looking at technical indicators, the RSI and MACD both appear to be trading at relatively neutral levels.
The PowerShares QQQ ETF (QQQ ) rose 0.61% over the past week, as of Thursday’s close. After breaking out from its prior highs, the index moved just above its R1 resistance at 93.08 over the past week. Traders should watch for a move higher towards its R2 resistance at 95.09 or a move back down to retest its trend line support at around 91.00. Looking at technical indicators, the RSI appears overbought at 72.43 while the MACD is stuck in a bearish downtrend.

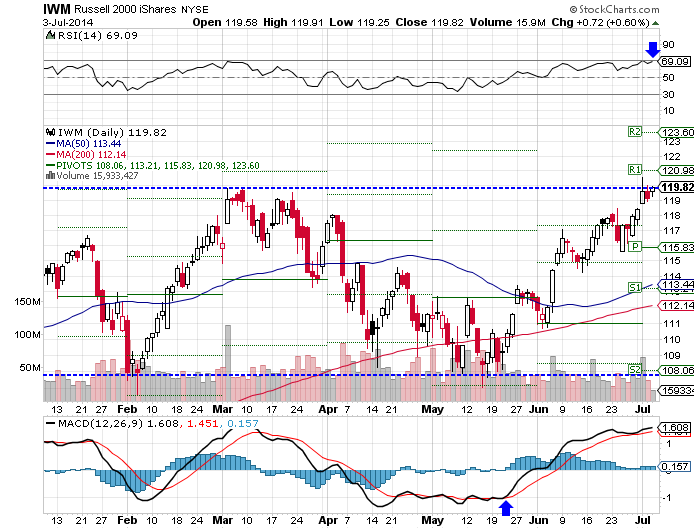
The iShares Russell 2000 ETF (IWM ) fell 0.63% over the past week, as of Thursday’s close. After crossing above its prior highs and R2 resistance at 117.78, the index moved back down a bit towards the 117.00 levels. Traders should watch for a breakout to retest its prior highs or a move down to its R1 resistance at around 115.32. Looking at technical indicators. the RSI appears modestly overbought at 61.21 while the MACD looks as if it could experience a bearish crossover.
The Bottom Line
The major U.S. indices moved largely lower over the past week as of Thursday’s close, with the notable exception of the NASDAQ. While some technical indicators are uncertain, indexes like the QQQ appear overdue for a correction. Traders will be watching a number of economic events next week, including the ISM Manufacturing Index on July 1and Employment Data on July 3.
Charts courtesy of StockCharts.com


