Analysis Why China s real estate construction is declining Market Realist
Post on: 14 Апрель, 2015 No Comment

Are we seeing the end of China's investment bonanza? (Part 3 of 5)
Analysis: Why Chinas real estate construction is declining
Fixed asset investment in China
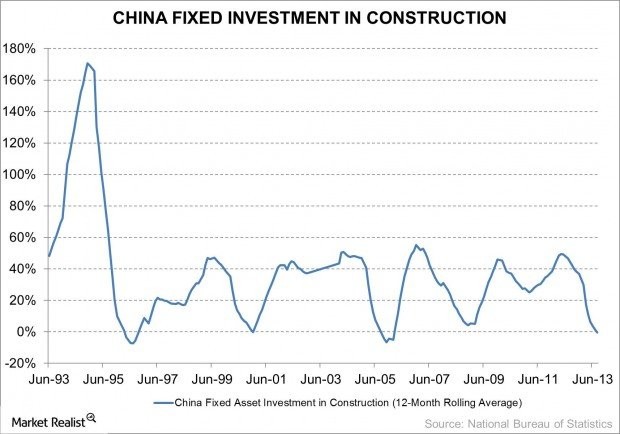
The below graph reflects the significant decline in fixed asset investment as a percentage of GDP as well as the significant decline in the growth rate of real estate–related construction and investment. As noted in the prior article, since 1996, overall construction in China has seen five boom and decline cycles in investment, rising to nearly 50% growth rates, and routinely falling to 0% growth rates—right where they are now. The below data for real estate–related construction shows less dramatic cyclicality, with the growth rate staying around 30% per annum since 1999, though nearly touching zero for a brief period during the 2008 crisis. As the government stimulus package of $586 billion led to recovery across a wide variety of economic indicators post-2008, including real estate investment, the data, like much other investment data, shows signs of resuming its decline. This article considers the implications of China’s real estate investment trends and the impact the decline could have on the overall economy and China’s equity markets.
A housing bubble?
The housing component of investments makes up approximately 12% of China’s gross domestic product, or GDP. In 2006, at the peak of the US housing bubble, housing made up roughly 6% of US GDP, while China stood at about 7% of GDP. In comparison, both Spain and Ireland saw housing reach just over 12% of GDP during the 2006 peak—much like China today. In retrospect, it’s easy to say that both Spain and Ireland overbuilt, and have since been saddled by excess capacity and debt problems. Housing prices vary widely in China, with housing cost-to-wage ratios reaching 22 times in the political center of Beijing, closer to 16 times in the export and financial market center of Shanghai, and six times in the manufacturing center of Chongqing.
The end of the bubble?
As the below graph reflects, the monthly increase in housing prices in China’s urban areas has declined dramatically since 2010. After peaking at nearly 24% per annum growth rates, metropolitan area housing prices are now growing at roughly 7.5% per annum—right in line with China’s 2013 second quarter GDP growth rate.
Will the bubble burst?
The above graph suggests that there’s no immediate cause for concern, as annual growth rates in housing costs are still quite high, at around 7.5%. This is in line with China’s overall economic growth rate, or GDP. However, should this rate continue to drop, further declines or flatlining prices could become problematic. The prior graph in this article shows that the rate of real estate investment has declined significantly, running at approximately 20% per year—half the rate of historical peaks. With new properties developing at a slower rate, the current price levels in China could be supported. The risk for the future trajectory of housing prices is more likely associated with China’s GDP growth rate slipping below the current level of 7.5% per annum. At the moment, it would appear that the real estate development and price relationship is adjusting to a more balanced equilibrium, consistent with slowing overall growth data. However, investors should be cautious of future declines in housing prices that aren’t offset by corresponding declines in housing construction.
Deflation could burst the “bubble”
Should the inventory overhang in China (which we saw in Part 1 ) continue to build while the economy cools, and the Chinese yuan continue to appreciate against global currencies—especially the Korean won and Japanese yen —then in fact the entire asset base of China could be in for a great leap backward. That would be a big negative for China’s corporate profits, employment data, housing prices, and equity markets. China’s Consumer Price Index has declined to 2.5%, and stands roughly in the middle of where it has ranged since the year 2000. Deflation is just a hop and a skip away. Unless global growth data picks up, and China maintains its current level of GDP growth, investors would need to pay careful attention to the threat of deflation regarding China’s asset prices—including equities. The next article in this series considers the impact producer price inflation, or lack thereof, is having on China’s economy and equity markets.
Outlook
For investors who think China can orchestrate a smooth deceleration in economic growth without significant disruptions to the banking system and also contain inflation, enhance productivity, manage investment growth, and grow domestic consumption, perhaps the weakness in Chinese equity prices over the past two or three years would present a more attractive price. China’s iShares FTSE China 25 Index Fund (FXI ) is down roughly 15% from its November 2011 post-2008 highs. For China skeptics seeking to embrace the more recent economic trends seen in Japan and the United States, as reflected in Japan’s Wisdom Tree Japan Hedged (DXJ ) and the iShares MSCI Japan (EWJ ), as well as the USA S&P 500 via the State Street Global Advisors S&P 500 SPDR (SPY ) and Blackrock’s S&P 500 Index (IVV ), the US and Japan markets may appear more attractive than China’s iShares FTSE China 25 Index Fund (FXI ) and South Korea’s iShares MSCI South Korea Capped Index Fund (EWY ). For further analysis as to why Chinese equities could continue to underperform Japanese equities, see Why Japanese ETFs outperform Chinese and Korean ETFs on “Abenomics .”


