What to Do when Traditional Diversification Strategies Fail – Revisited
Post on: 22 Июнь, 2015 No Comment

What to Do when Traditional Diversification Strategies Fail – Revisited
An Updated Diversification and Asset Correlation Study Accounting for Zero-Commission Exchange Traded Funds
Reduced costs of trading commissions are a welcome new benefit of using ETFs as portfolio building blocks, but the cost of the bid-ask spread can be significant if low-volume ETFs are mixed into a diversified portfolio.
gsbm-med.pepperdine.edu/gbr/audio/fall2010/dilellio-diversification.mp3]
The market events of 2008 stressed the ability of diversification to protect against loss due to rapidly changing correlation amongst assets. But, as demonstrated in the initial article, What to Do When Traditional Diversification Strategies Fail , there is still a simple, repeatable approach based on utilizing previous year correlation coefficients to construct a diversified portfolio that reduces loss of principle.[1] The significant market gains of 2009 further challenge the benefits of diversification. So, the question now is: Does this approach to diversification also provide opportunity for significant positive gains? To answer this question, we revisit the simple diversification strategy featured in the previous article, which exploits correlation to reduce risk, to see if opportunities for gains exist.
Furthermore, a recent competition between brokers has been driving down commissions for online trades. In addition to lower commissions, some brokers have selected a subset of ETFs from a single provider, such as iShares affiliation with Fidelity, and waived all commissions when trading these financial products within their online platform. These reduced costs are important and may have a direct influence on the optimal reallocation frequency. So, a new question now is: With the reduction or elimination of trade commissions, is a more active strategy optimal? This article also examines this practical issue, and quantifies the overall benefits from $0 ETF commissions currently in the marketplace.
Hypothesis Revisited
This study revisits many of the hypotheses established in the previous study. The correlation coefficient threshold is validated from an updated illustration containing four asset classes: U.S. Large Caps, U.S. Small Caps, International, and Bonds. As seen in Table 1, correlations observed over 2008 suggest the same allocations against U.S. Large Caps (SPDR S&P 500 fund, symbol: SPY) and Bonds (iShares Aggregate Bond Fund, symbol: AGG) as suggested from correlations observed over 2007.[1] But, because of the continuing trend of lower commission costs, consideration must also be given to volume in the process of identifying uncorrelated assets. Volume is known to be inversely related to costs from bid-ask spreads and is empirically modeled in the following section. So, to provide a preference to higher volume funds that minimize the resulting bid-ask spread, the correlation matrix rows are generated in order of decreasing volume before eliminating highly correlated investment options. The result to the right of the arrow illustrates the result, applying this process to a four-asset class example.
Table 1: Correlation Coefficients from Daily Returns Adjusted for Dividends in 2008, sorted by Average Daily Volume.
Table 2 shows the associated 2009 performance, based on holding both the four-asset portfolio as well as the suggested two asset portfolio based on the 80 percent correlation threshold. The diversification effect observed in 2008 reduced the 2009 portfolio gain from 21 percent to 14.3 percent. Reviewing the 2008 portfolio returns (illustrated in the previous article), we observe a loss of 27 percent and 15 percent, respectively, where the smaller loss occurrs when we apply the correlation threshold to portfolio construction. Thus, the two-year cumulative return from this simple illustration is -12 percent when no correlation threshold is applied, versus -3 percent when it is applied.
Table 2: 2009 Performance of Naïve Allocation with and without use of 2008 Correlation Coefficients.
This updated simple illustration continues to suggest a benefit of multi-asset diversification or wide diversification, consistent with other research.[2] [11] While these studies use longer history market indices, we show a more pragmatic view in the following sections, since the ETFs examined are easily traded by individuals, investment advisors, hedge funds, and institutional investors. Furthermore, ETF transaction costs can be accurately modeled, as shown in the next section. Unfortunately, ETFs are still fairly new investment products, so they do not offer the long histories available for many asset allocation studies employing equity, bond, and commodity-based indices used in the aforementioned studies.
Analysis Assumptions and Methodology
Continuing with the nine asset classes identified in the previous article, including the 136 unique ETFs available since January 2004, we have added an analysis of new zero-commission ETFs now being offered by Schwab, Fidelity, and Vanguard. Six of the asset classes are equity-based and consist of large cap domestic, large cap foreign, emerging markets, midcap domestic, small cap domestic, and domestic sectors. The three non-equity classes include commodities, bonds, and real estate. A summary of the nine asset classes represented by these ETFs appears in Table 3, where sector and large cap domestic assets have the largest representation, while bonds and real estate assets have the smallest.
Table 3: Asset Classes represented by 136 Exchange Traded Funds available since January 2004 (values are rounded to the nearest percent).
Based on the updated simple illustration from above, we continue to define uncorrelated assets using a correlation matrix generated by volume. We then eliminate lower volume assets that are more than 80 percent correlated with higher volume assets. All correlation coefficients were calculated based upon 12 months of daily historical returns developed from adjusted closing prices that included dividends and splits. For consistency, volume was also estimated using a 12-month average daily volume. This methodology follows the same rationale established in the initial paper.

Revisiting the existing assumption regarding switching costs, we have updated our methodology to address the practice of investment managers seeking most liquid ETFs.[4] To further improve the fidelity of the back-testing, we have also incorporated a nonlinear regression model for a bid-ask spread that grows rapidly with low volume. The model parameters are based on empirical data provided by Pankaj Agrrawal and John M. Clark in their 2009 article, Determinants of ETF Liquidity in the Secondary Market: A Five-Factor Ranking Algorithm.[3] This data is represented in Figure 1. The value of R 2 = 94 percent obtained from the power-law model suggests that a significant amount of the variation has been explained between the bid-ask spread and the trailing volume, providing high confidence in the models ability to accurately reflect bid-ask costs based on volume.
Figure 1: Bid-Ask Spread, in Basis Points (BP) versus Average Volume, with Power Law Regression model and Goodness of Fit Measure.
The model in Figure 1 is applied against hypothetical trades using month-end adjusted closing price and volume. Returns were calculated based on a naïve allocation approach that evenly spreads assets across uncorrelated ETFs. The purpose is to examine the datas sensitivity to annual, biannual, and quarterly rebalances. To reflect the latest updates in commissions from discount brokerages such as Vanguard, trade commission are reduced from $10 to $5 per trade against a portfolio starting with $100,000 in a tax-free account.[7]
Empirical Results
Figure 2 appears to have a very similar downward trend, but contains a full five years of history. Once again, the increased correlation amongst assets classes increases over time, yielding fewer uncorrelated funds. Also note that including volume as part of the process to determine uncorrelated funds has had a marginal effect on the total number of uncorrelated funds, but the downward trend from 2005-2009 remains.
Figure 2: Number of ETFs that are less than 80 percent correlated over previous year with higher volume ETFs (2005 – 2009).
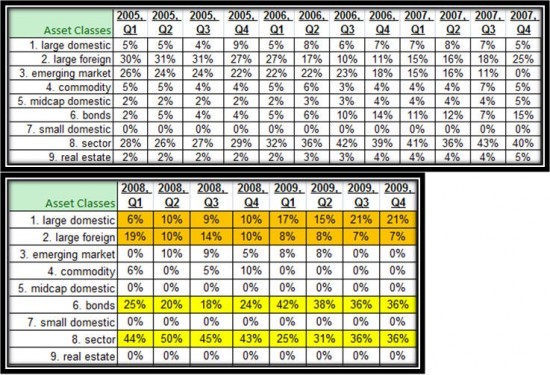
Tables 4, 5, and 6 list the portfolio allocations against each of the nine asset classes for the annual, biannual, and quarterly rebalancing periods. In each case, the allocations begin in 2005 with a majority of holdings in large foreign equities, emerging markets, and domestic sectors. By 2009, large domestic equity increases significantly, while large foreign equities and emerging market allocations shrink drastically, as highlighted in orange. Highlighted in yellow, bond funds continue to grow to become 43 percent of the allocation, one of the largest percentages seen over the five-year study. Lastly, domestic sectors remain a significant percentage of the allocation throughout the five-year study, suggesting a cyclical pattern between the range of approximately 25 percent and 45 percent. In summary, these results indicate that the naïve allocation strategy appears to be achieving wide diversification, based on the portfolio containing between five and eight asset classes throughout the five-year testing period.[2] Furthermore, the strategy appears to have a dynamic component that, in times such as early 2009, approaches the classic allocation of 50/50 bond-equity allocation.
Table 4: Annual Portfolio Allocation Percentages with Naïve Allocation Approach and 80-Percent Correlation Threshold
Table 6: Quarterly Portfolio Allocation Percentages with Naïve Allocation Approach and 80-Percent Correlation Threshold.


