Volume Rate of Change Momentum Indicator Measuring Volume
Post on: 27 Апрель, 2015 No Comment

VROC — Measuring Volume To Confirm Momentum
You can opt-out at any time.
The Volume Rate of Change indicator is a type of momentum indicator that is often used by traders to quantify the current momentum and the true underlying conviction in a trading instrument based on volume. The VROC is classified as a centered oscillator (a commonly-used technical analysis tool measuring movement above and below a zero centerline) comparing current and previous volume. Unlike Rate of Change and other momentum price indicators. VROC is blind to the price movement of the instrument being measured.
VROC demonstrates the velocity (speed) at which the trading volume is increasing or decreasing over a period of time, signaling that there is either positive or negative momentum in the instrument that is being measured. The oscillator signal fluctuates as a percentage around the zero line. A signal above the zero line is positive and indicates that the current volume change has increased over the previous period. Inversely, the indicator signal will be negative (below the zero line) when the current volume change has declined from the previous period.
VROC is a widely-used indicator that traders can expect to find offered among the core package of tools provided by most commercially available charting services. Although there are several options in terms of how the signal can be displayed, including both bar and candlestick charts, it is generally presented as a line chart. which is plotted separately in a window directly beneath the primary price chart.
How It’s Calculated
Description: VROC measures the current volume of a trading instrument against the volume of the same instrument in a previous period (the common default is 14 days, but day traders will generally decrease the period that is measured to account for the short-term nature or their trades) to determine if volume in general is either increasing or decreasing. It compares the current volume change to the volume in the previous period to give indication as to the strength or weakness of the current volume. That information provides traders insight as to whether the current trend is likely to continue or is in fact suspect, which might signal an imminent change in trend. VROC is obtained by dividing the volume change over a previous period (N) by the volume of the previous period (N).
Calculation: VROC = [(Current Volume — Volume N Previous Period) / (Volume N Previous Period)] X 100
(N = previous period — e.g. 14 days)
Trading Use
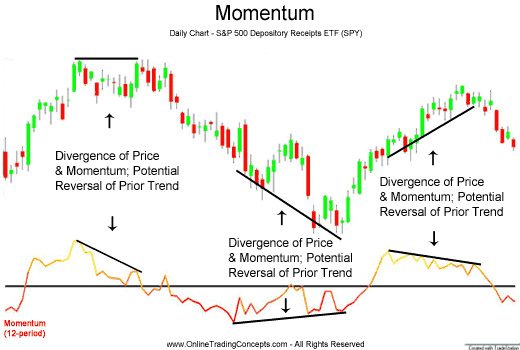
VROC is most useful to traders when used to confirm price moves. It is also a good tool for identifying possible divergence between price movement and momentum — often a precursor to a trend change or reversal. A positive or inclining signal above the zero line can serve to validate the current price trend (bullish or bearish) while a negative or declining signal below the zero line is cautionary and indicates an existing trend may be weakening. Traders often use VROC to gauge whether or not a trading instrument has the necessary momentum to break through key support or resistance levels, as well as to forecast possible trend breaks and reversals.
The number of periods selected for comparison is an important element — longer time frames are best suited for swing or longer-term trades, while shorter periods are more suitable for day trades. Day traders do need to consider the fact that utilizing a shorter period can cause the indicator to be more prone to fluctuations and false signals, so it’s important to test varying time frames to get a good feel for the indicator before trading live using VROC. The VROC indicator is generally used in conjunction with a price chart and other indicators to avoid whipsaw.


