Volume and Open Interest How to Use it to Trade More Effectively (Tue Jun 19 2007)
Post on: 3 Июнь, 2015 No Comment

Choose a complimentary trading e-book immediately upon registration. Registration and resources are free – Join Now.
Futures volume and open interest are significant factors to monitor when trading futures, for several reasons. First, let’s define the two terms.
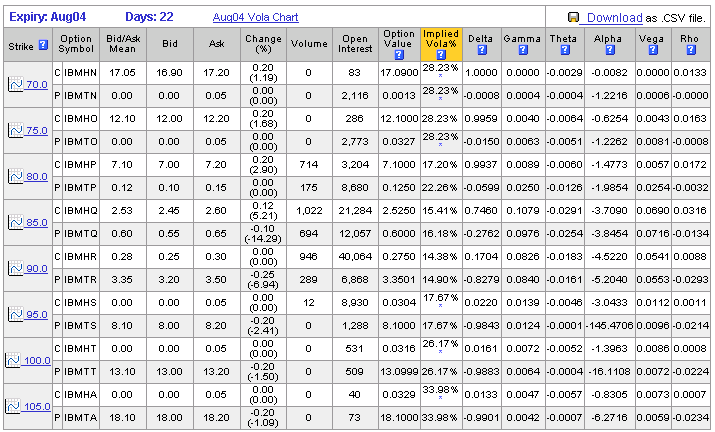
Open interest is the total number of futures or options on futures contracts that have not yet been offset or fulfilled by delivery. It is an indicator of the depth or liquidity of a futures market, which influences the ability to buy or sell at or near a given price.
Open interest can be a tricky concept, especially for beginners. In a nutshell, here’s how open interest is calculated: If a new buyer (a long) and new seller (a short) enter a trade, open interest increases by one. However, if a trader already holding a long position sells to a new trader wanting to initiate a long position, open interest remains the same. And if a trader holding a long position sells to a trader wanting to get rid of his existing short position, open interest decreases by one.
Volume is the number of transactions in a futures or options on futures contract made during a specified period of time. It is usually recorded for one trading session.
You will want to exercise extra caution when attempting to trade a market with very low volume and open interest—or in other words, an illiquid market. Good and timely fills (order execution) may be hard to obtain. Also, markets with lots of liquidity are less likely to be manipulated by traders.
Most veteran futures traders agree that volume and open interest are secondary technical indicators that help confirm other technical signals on the charts. In other words, traders won’t base their trading decisions solely on volume or open interest figures, but will instead use them in conjunction with other technical signals, or to help confirm signals.
For example, if there is a big upside price breakout in a futures market (or a stock, for that matter) that is accompanied by heavy volume, then that only makes the upside move a stronger trading signal. Also, a big upside move or a move to a new high that is accompanied by light volume makes the move suspect. Big price moves (up or down) accompanied by heavy volume are powerful trading signals. If prices score a new high or new low on lighter volume, then that is an indication a top or bottom may be near or in place. Also, if volume increases on price moves against the existing trend, then that trend may be nearing an end. This is called divergence.
As a general rule, volume should increase as a trend develops. In an uptrend, volume should be heavier on up-days and lighter on down-days within the trend. In a downtrend, volume should be heavier on down-days and lighter on up-days.
Changes in open interest also can be used to help confirm other technical signals. Open interest can help the trader gauge how much new money is flowing into a market, or if money is flowing out of a market. This is helpful when looking at a trending market.
Another general trading rule is that if volume and open interest are increasing, then the trend will probably continue in its present direction—either up or down. And if volume and open interest are declining, this can be interpreted as a signal that the current trend may be about to end.
Here’s a difference in open interest, as opposed to volume: Open interest has seasonal tendencies—higher at some times of the year and lower at some times of the year, in many markets. The seasonal average of the open interest is important in analyzing open interest figures. If prices are rising in an uptrend and total open interest is increasing more than its seasonal average (5-year average), new money is considered to be flowing into the market, indicating aggressive new buying, and that is bullish.
However, if prices are rising and open interest is falling by more than its seasonal average, the rally is being caused by the holders of losing short positions liquidating (short covering) and money is leaving the market. This is usually bearish, as the rally will likely fizzle.
The same holds true in a downtrend. Open interest increasing more than its seasonal average on the downmove means new aggressive sellers entering the market, and this is bearish. But if open interest is declining more than the seasonal average on the downmove, then it’s likely holders of long positions are liquidating their losing trades (long liquidation), and that the downtrend may be near an end.
Here are two more rules for open interest:
Very high open interest at market tops can cause a steep and quick price downturn.
Open interest that is building up during a consolidation, or basing period, can strengthen the price breakout, when it happens.
Many seasoned traders like to examine the Commodity Futures Trading Commission’s (CFTC) Commitments of Traders (COT) reports, for changes in open interest and to see what the big speculators and commercial traders are doing. More information on the COT reports is available free at the CFTC’s website at www.cftc.gov.


