Volatility Trading Using Excel to Calculate Stock Volatility
Post on: 24 Май, 2015 No Comment

Download the zipped version Historical Volatility (35 KB)
The above spreadsheet will download historical stock prices from the web and calculate the historical standard deviation for the range of values that you specify.
You can download stock data as far back as Yahoo!’s database allows and choose your own historical lookback period. And it’s free.
Volatility is the most crucial of all option trading concepts. Volatility indicators provide traders with an estimate of how much movement a stock can be expected to make over a given time frame. This is crucial in determining whether an option is likely to expire in or out of the money by the expiration date.
Understanding volatility also helps traders understand whether an option is cheap/expensive relative to the historical facts of the underlying instrument.
There are two types of volatility that we will be looking at: Implied Volatility and Historical Volatility.
Volatility Definition
Historical Volatility is a statistical calculation that tells option traders how rapid price movements have been over a given time frame. The most common method of calculating historical volatility is called the Standard Deviation.
Standard Deviation measures the dispersion of a set of data points from its average. The more disperse (spread out) the data is, the higher the deviation. This deviation is referred by traders as volatility.
Don’t get too caught up in trying to understand the how’s and whys of the standard deviation, just accept that all traders use this method for determining historical volatility. However, if you want more of an explanation you can refer to Appendix C of Option Volatility & Pricing for a calculated example of standard deviation.
Or, you can download the Historical Volatility.xls spreadsheet for an example of how to calculate historical volatility.
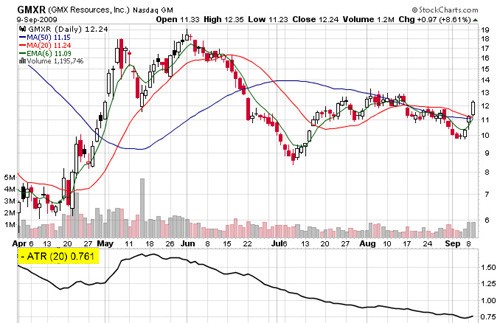
Assets that have large and frequent price movements are said to be volatile or said to be of high volatility. Consequently, assets whose price movements are slow and predictable are said be low volatile instruments. Take a look at the following examples of high and low volatile assets.
Take a look at the examples below of a highly volatile stock and a low volatile stock;
High Volatility
Low Volatility
Why is volatility so important to option traders? Because volatility is a measure of the possible price changes of the asset in the future. Assets that have high volatility can be expected to have large price changes in the future. As a result, options that are based on assets with high volatility can be expected to have higher prices.
The higher the volatility, the more likely it is that the underlying asset will trade higher (or lower) than the exercise price by the expiry date.

Implied Volatility
Implied volatility is the markets view of where volatility will be in the future. To determine an option’s implied volatility, the trader must use a pricing model .
But for now, take a look at the following illustration;
Historical Volatility tells us how volatile as asset has been in the past. Implied Volatility is the markets view on how volatile as asset will be in the future.
We can tell how high/low implied volatility is by comparing the market price of an option to the options theoretical fair value. This is why we need to use an option pricing model — to determine the fair value of an option and hence know if the market price for the option is over/under valued.
When the market price of an option is higher than it’s theoretical value (based off past information) it is considered expensive and so to if the market price of the option is less than the theoretical price, it is considered cheap.
Another way to look at implied volatility is to compare the current level of implied volatility to the average level of implied volatility for the same option.
It’s a sound approach, however, building your own database of implied volatility data for every US stock requires a huge investment of time and resources. If you’re interested in this idea though, then I suggest you take a look at the Volcone Analyzer Pro by Options University. It instantly tells you if an option is cheap or expensive relative to the historical volatility levels.
Volcone Analyzer Pro


