Volatility Squeeze Trading
Post on: 3 Июль, 2015 No Comment

A Volatility Squeeze occurs when the volatility of a stock falls below its recent levels. A fall in volatility usually means that the stock is in a period of consolidation and trending in a narrow range. When that period of consolidation ends, normal volatility will return resulting in a breakout to the upside or downside. If we can recognize a volatility squeeze situation, then we have the opportunity to place a long or short position order and profit from the breakout. Volatility Squeeze breakouts are particularly suited to the swing trade or options trade investor because they tend to give quick short term gains.
How can we recognize a Volatility Squeeze?
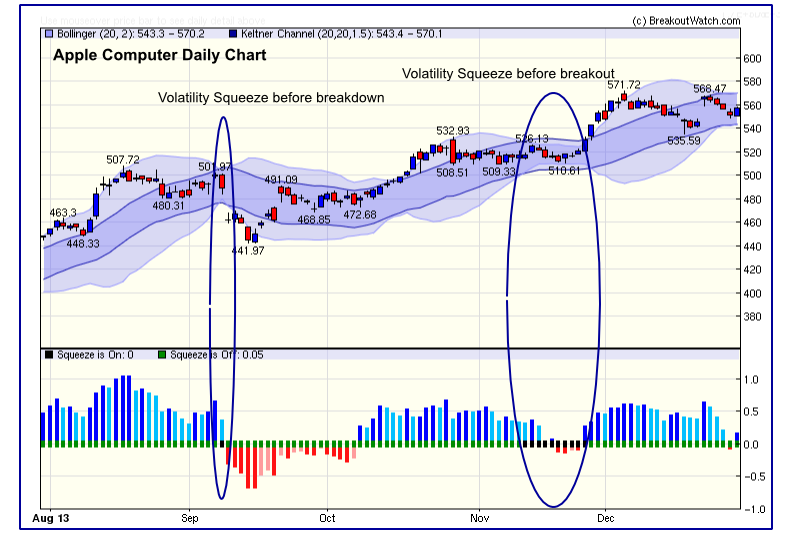
A Volatility Squeeze is usually recognized by a narrowing of the Bollinger Bands. For this reason it is often known as a Bollinger Band Squeeze. While searching for Bollinger Band Squeezes will produce a sometimes lengthy list of volatility squeeze candidates, it lacks the objectivity necessary to provide a robust, objective, quantifiable trading strategy, We have developed a refinement of the methodology which allows objective identification of a Volatility Squeeze, We detect a squeeze when the 2 standard deviation Bollinger Band narrows to within the Keltner Channel. Because this situation can be detected algorithmically, we are able to scan thousands of stocks daily for a Volatility Squeeze situation and publish them on breakoutwatch.com. Five examples from our current Volatility Squeeze watchlist (which we cal SqueezePlay are shown on this page
Volatility Squeeze Example
In this example, Apple Computer (AAPL) demonstrates both a Volatility Squeeze before breakdown and before breakout. The outer light blue band is the Bollinger Band and the inner darker blue band is the Keltner Channel. The lower chart shows momentum (positive in blue and negative in red) and the center line shows when the squeeze is on (black rectangle) and off (green rectangle).
How do we trade a Volatility Squeeze?
While the upper and lower Bollinger Bands are within the Keltner Channel, we say the squeeze is on. For trading purposes, we are interested in the moment when the squeeze comes off, meaning that the upper and lower Bollinger Bands move outside the Keltner Channel, which signals a breakout. This occurs when the stock price rises or falls sufficiently to increase the volatility so the Bollinger Band widens. Note that the price doesn’t have to move outside either channel, it only has to move sufficiently to widen the Bollinger Band. The price necessary to create this move can be determined at the end of each trading session in advance of the next session’s trading. We call this the breakout price. This allows us to place a stop or stop-limit order to set up a long or short position if we cannot monitor the market in real time.
Perhaps the most profitable way to trade the Volatility Squeeze is with a directional options trade. You would buy an in the money Call option at the closest strike price to the breakout price and still be in the money. Buy the closest expiration unless there are less than 7 days left-in which case go to the next month. Look for reasonable options volume near the strike price and a narrow bid-ask spread. If the price rises you can sell the option at a profit or simply let the option expire.
How do we recognize the best Volatility Squeeze situations?
A stock can be in a Volatility Squeeze for several days as seen in the APPL chart above. Additionally, there can be hundreds of stocks in a Volatility Squeeze at any one time. Consequently, we need a method of selecting the situations which are most likely to lead to a breakout and therefore a profitable trade. Through analyzing successful breakouts since January 2008 (which includes the strongest bear market in our lifetimes) I have been able to develop a model that determines the probability that a breakout will occur. The key factors in determining a successful breakout are:
- a Volatility Squeeze situation
- price momentum and its rate of change
- proximity of price to breakout price
- overall market trend

My model is successful in predicting a breakout 70% of the time, giving a comfortable risk/reward ratio.
Where can I find a list of stocks in a Volatility Squeeze?
Since 2001, I have been operating breakoutwatch.com which specializes in looking for stocks in a potential breakout situation using chart pattern analysis. One of the situations I look for is stocks that are trending up but are temporarily in a Volatility Squeeze. I put these stocks on a watchlist called SqueezePlay™. This short video introduces the breakoutwatch.com site, charting, a cup-with-handle squeeze and the advantages of our SqueezePlay™ watchlist.
Each day, this site, volatilitysqueeze.us, will publish free of charge the five stocks on the SqueezePlay™ list with the highest probability of breakout to the upside that are also optionable. For all the stocks on SqueezePlay, go to breakoutwatch.com
Get More Stocks in a Volatility Squeeze
Breakoutwatch.com analyzes the markets each day to find stocks in a breakout (long) or breakdown (short) situation. In addition to the SqueezePlay™ watchlist, we have watchlists for stocks in cup-with-handle, double bottom, head and shoulders bottom, high tight flag, flat base, head and shoulders top and 50 DMAA breakdown patterns. For each stock that is in a volatility squeeze situation, that information is added to the watchlist. I have found that breakouts that are simulteneously in a volatility squeeze have a bigger short-term pop and this makes them ideal candidates for options trading.
- Go to breakoutwatch.com
Today’s Top Picks
Each day this site publishes the five stocks on the breakoutwatch.com SqueezePlay™ list with the highest probability of breakout to the upside that are also optionable. This list was published on 03/12/2015 for trading at the next session.


