Volatility Smiles & Smirks Explained
Post on: 1 Июль, 2015 No Comment

Volatility Skew Definition:
Using the Black Scholes option pricing model, we can compute the volatility of the underlying by plugging in the market prices for the options. Theoretically, for options with the same expiration date, we expect the implied volatility to be the same regardless of which strike price we use. However, in reality, the IV we get is different across the various strikes. This disparity is known as the volatility skew.
Volatility Smile
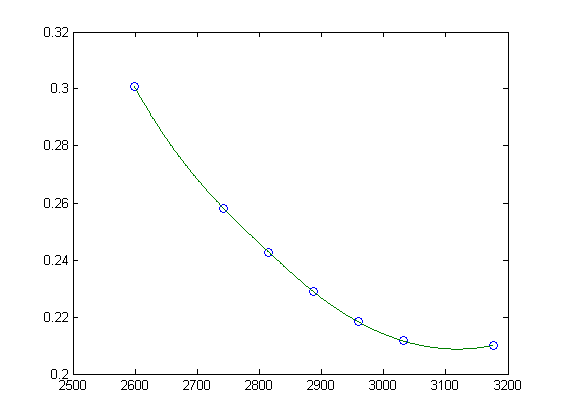
If you plot the implied volatilities (IV) against the strike prices, you might get the following U-shaped curve resembling a smile. Hence, this particular volatility skew pattern is better known as the volatility smile.
The volatility smile skew pattern is commonly seen in near-term equity options and options in the forex market.
Volatility smiles tell us that demand is greater for options that are in-the-money or out-of-the-money.
Reverse Skew (Volatility Smirk)
A more common skew pattern is the reverse skew or volatility smirk. The reverse skew pattern typically appears for longer term equity options and index options.
In the reverse skew pattern, the IV for options at the lower strikes are higher than the IV at higher strikes. The reverse skew pattern suggests that in-the-money calls and out-of-the-money puts are more expensive compared to out-of-the-money calls and in-the-money puts.
The popular explanation for the manifestation of the reverse volatility skew is that investors are generally worried about market crashes and buy puts for protection. One piece of evidence supporting this argument is the fact that the reverse skew did not show up for equity options until after the Crash of 1987.
Another possible explanation is that in-the-money calls have become popular alternatives to outright stock purchases as they offer leverage and hence increased ROI. This leads to greater demands for in-the-money calls and therefore increased IV at the lower strikes.
Forward Skew
The other variant of the volatility smirk is the forward skew. In the forward skew pattern, the IV for options at the lower strikes are lower than the IV at higher strikes. This suggests that out-of-the-money calls and in-the-money puts are in greater demand compared to in-the-money calls and out-of-the-money puts.
The forward skew pattern is common for options in the commodities market. When supply is tight, businesses would rather pay more to secure supply than to risk supply disruption. For example, if weather reports indicates a heightened possibility of an impending frost, fear of supply disruption will cause businesses to drive up demand for out-of-the-money calls for the affected crops.
Your new trading account is immediately funded with $5,000 of virtual money which you can use to test out your trading strategies using OptionHouse’s virtual trading platform without risking hard-earned money.
Once you start trading for real, your first 150 trades will be commission-free! (Make sure you click thru the link below and quote the promo code ’90FREE’ during sign-up)


