Volatility Index Arbitrage A Specific Case VIX v
Post on: 3 Июнь, 2015 No Comment

This months “VIX Futures in Focus” included in this month’s “Futures in Volatility” from the CBOE Futures Exchange (CFE) marks the last monthly issue. Forthcoming issues will be published on a monthly basis and will allow for more detailed discussion of different facets of the rapidly growing market for volatility products.
This issue concludes the inter-asset volatility arbitrage conversation with a specific focus on the spread between the VIX and VXN that has recently witnesses extreme levels.
Volatility Index Arbitrage: A Specific Case
The article below is provided by Michael McCarty. Mr. McCarty is the founding member and chief strategist of Differential Research.
CBOE Futures Exchange, LLC (CFE) lists futures and security futures on six different volatility indexes that provide up-to-the-minute market estimates of the expected volatility of several different asset classes. These six unique products are calculated by applying the CBOE Volatility Index® (VIX®) methodology to CBOE-listed options on a diverse group of stock indexes and exchange-traded funds (ETFs). This column for the last few months has focused discussion on the potential for inter-market volatility arbitrage opportunities among these products and the possibility to capitalize on changing relative volatility expectations between asset classes.
This month we will look at a specific relationship between implied volatility for the S&P 500 Index (SPX) as represented by the VIX and implied volatility for the NASDAQ-100 Index (NDX) represented by the CBOE NASDAQ-100 Volatility Index® (VXN®).
With the reintroduction of VXN futures this year, we note that data is very limited and relationships are likely to change as trading volumes and open interest grow for both the options on the underlying indexes used in the calculation and the volatility futures markets. However, a small data set provides a simple platform for demonstrating the spread analysis process.
As a starting point to explore why implied volatility differs for the SPX and NDX indexes, we first look at the differences between the two indexes. The SPX Index is a capitalization weighted index, as described by S&P:
500 leading companies in leading industries of the U.S. economy. Although the S&P 500® focuses on the large cap segment of the market, with approximately 75% coverage of U.S. equities, it is also an ideal proxy for the total market.
The NDX Index is a cap-weighted index. as described by NASDAQ:
100 of the largest domestic and international non-financial securities listed on The Nasdaq Stock Market based on market capitalization. The Index reflects companies across major industry groups including computer hardware and software, telecommunications, retail/wholesale trade and biotechnology. It does not contain securities of financial companies including investment companies.
Differences in risk expectations for different sectors or components of the index are likely to drive differences in values for the VIX and VXN indexes and futures. For example, Apple Computer (AAPL) is the largest constituent stock in both indexes. However, recently Apple Computer comprised approximately 18.5% of the NDX Index but only 4.4% of the SPX Index. (Sources S&P and NASDAQ). Moreover, the relative influence of Apple is likely greater on the NDX Index due to the greater relative representation of Apple suppliers and distributers. This fact is well known and motivates a popular equity spread trade that seeks to arbitrage the prices of the SPX and NDX Indexes around important dates for Apple, such as earnings reports and new product introductions. Success however is directionally dependent, requiring knowledge of whether Apple trades up or down on the announcement, and is not a prerequisite for success in a volatility arbitrage trade. Volatility is likely to decline regardless of outcome as the uncertainty passes and the perceived risk is diminishes.
Second, we look at the potential for any differences between the calculation of the indexes and the settlement process for the futures. VIX and VXN futures both have a $1,000 contract multipliers and their settlement values are based on the A.M. settlement values of the option series making up each index. The settlement value for VIX and VXN futures are both calculated using the VIX methodology.
Finally, we will look at data for both the front-month futures and longer term futures and at the relationship between the calculated underlying volatility indexes. For our analysis we use daily closing prices for the VIX and VXN Indexes from 1/4/2010. We use daily settlement prices for the front month futures from 6/20/12, labeled VX1 and VN1. It is important to note that constant serial futures, like the constant front-month future, are disjointed series. The underlying future changes each month, positions or spreads may need to be rolled to subsequent months at or before resulting in additional costs. Also the indexes are not tradable products.
However, since we are most interested in ranges and extremes, our analysis will suffice.
Sources: CFE, Differential Research, LLC
Looking at the graph of settlement prices, it is apparent that the VIX and VXN Indexes appear to be highly correlated, as are the two futures. Likewise, the VIX and VXN Indexes and the futures appear to be highly correlated, lending credibility to the value of analyzing the longer historical data available for the volatility indexes.
Sources: CFE, Differential Research, LLC
The summary statistics data further confirms similar distributions.
Sources: CFE, Differential Research, LLC
The futures data suggests that the VIX and VXN Indexes and respective futures are more highly correlated -than they appear to be.
Sources: CFE, Differential Research, LLC

Looking at the spreads in dollar terms:
Sources: CFE, Differential Research, LLC
While the maximum VXN premium to the VIX Index and the VN1 premium to the VX1 are close, the VN1 futures discount for the shorter period is significantly less than the maximum VXN discount to the VIX for the longer period.
Sources: CFE, Differential Research, LLC
Of particular interest, the VXN and VN1 premiums to the VIX and VX1 are near the highest level for the periods under review.
Sources: CFE, Differential Research, LLC
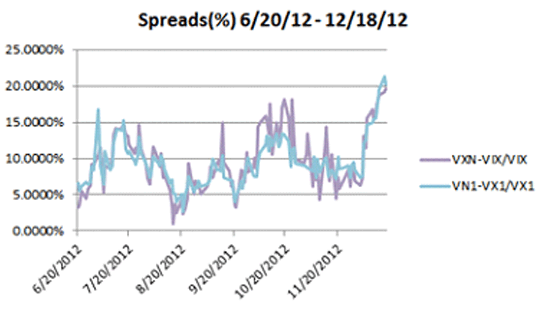
That extreme is also present when the spread is viewed on a percentage basis.
Sources: CFE, Differential Research, LLC
data sources: CFE, Trade-Alert LLC, Yahoo Finance and Differential Research LLC
The risk of loss in trading commodity futures and options is substantial. Before trading, you should carefully consider your financial position to determine if futures trading is appropriate. When trading futures and/or options, it is possible to lose more than the full value of your account. All funds committed should be risk capital. Past performance is not necessarily indicative of future results.


