Using Fibonacci Analysis To Predict Market Breakouts
Post on: 19 Июль, 2015 No Comment

August 18 2011
Fibonacci analysis is crucial to an options trader and almost all traders generally speaking do use retracements and extensions as part of their strategy. Its a topic that Ive covered multiple times before here on this blog as well. Over the years Fibonacci levels have proven to be exceptionally accurate at predicting market movements and this can help traders devise strategies to make more profit.
Trading Breakouts
Share
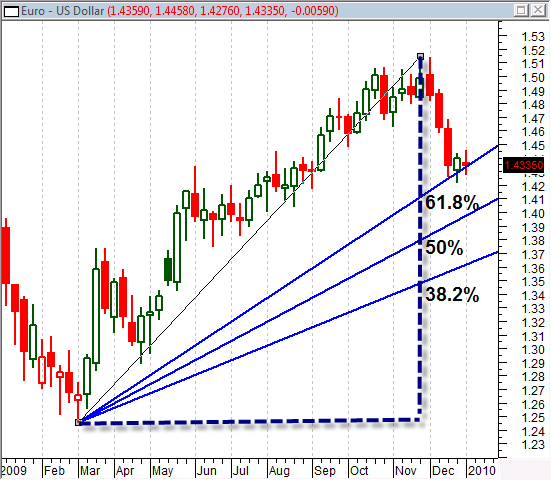
Fibonacci retracements and extensions rely on a trader accurately choosing the low and high points of an overall trend. Once this is done the Fibonacci analysis can be applied to a candlestick chart and a number of key Fibonacci ratios will be presented on the candlestick chart as horizontal lines.
Use Fibonacci Levels For Support/Resistance
The lines help project points of resistance and support and they can also be used to suggest when a breakout is likely to occur. The two key ratios are 38% and 62% and often when a security is trading it can rebound back and forth between these two ratios.
If this is happening a lot and the market looks congested between these two points then the retracements are suggesting that a price breakout is imminent.
When a price breakout occurs the price of a security will often move dramatically outside of the 38% and 62% ratios and the market will change significantly. The presence of price congestion in between these two lines created by the Fibonacci retracement suggests the market price will move and this is the point at which a trader should act.

Dont Use Them Alone!
Fibonacci analysis is best used in conjunction with another indicators to confirm if the breakout is definitely going to happen. Like all technical analysis tools we use, a trader shouldnt simply rely on the analysis provided by the Fibonacci retracement without checking other indicators.
Using the evidence of two indicators is a much more reliable strategy because if the two suggest a breakout is likely then it will probably happen but if they contradict each other a trader should stay out of the market.
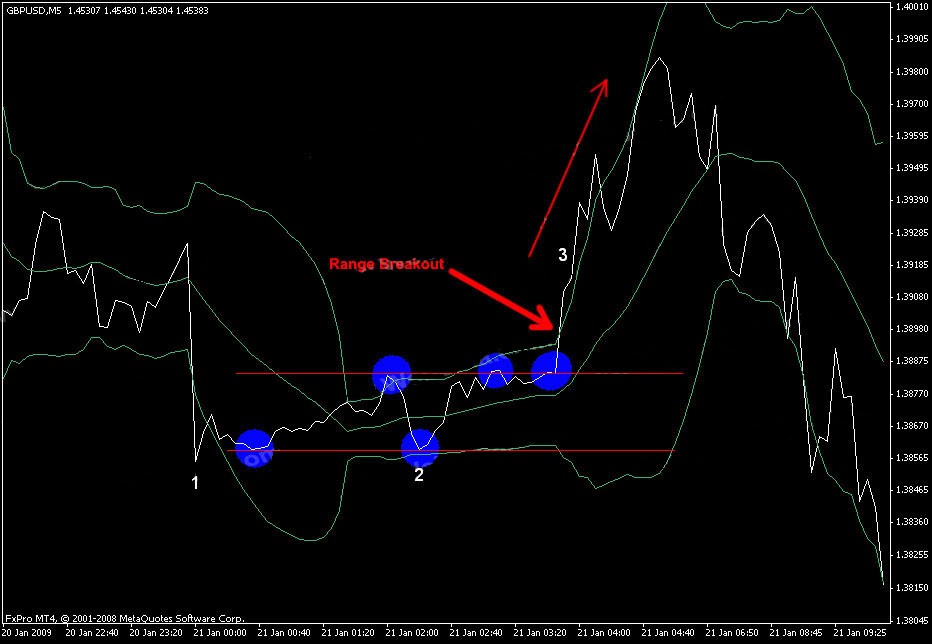
Bollinger bands are excellent at predicting breakouts and when they begin to contract, this is a signal a price breakout will occur. This behavior is known as the Bollinger squeeze and if a trader correctly identifies it whilst also noticing congestion in the Fibonacci retracement, they can be fairly certain the breakout is imminent.


