Using a Collar Options Strategy to Limit Downside Risk
Post on: 19 Июнь, 2015 No Comment

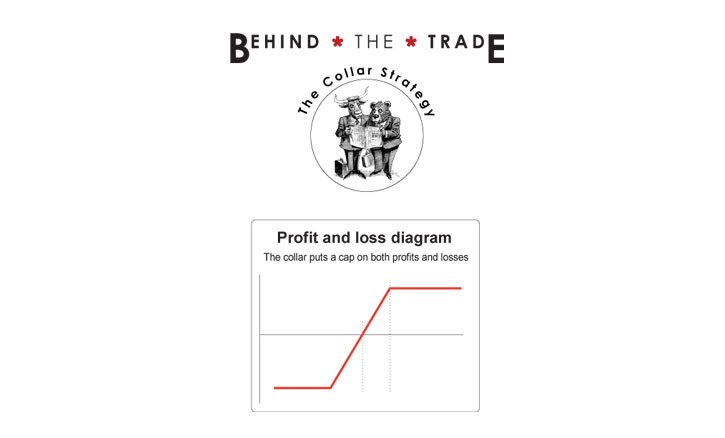
Hello, I’m Brian Overby, Senior Options Analyst at TradeKing. TradeKing is an online stock and options broker. We’re known for our award-winning customer service, cutting-edge tools, and our competitive pricing — we’re only $4.95 a trade. We also have a very active Trader Network, which is a community of traders of all levels of experience where you can see real trades from our members and their performance, and you can share your trade ideas and discuss what’s happening in the marketplace. If you’d like to learn more, please check us out at tradeking.com. Today’s topic is going to be collars, how to collar your stock to limit some downside risk in the marketplace. Now, if we look at options, there are four basic trades that you can do with options: you can buy a call, you can buy a put, you can sell a call and you can sell a put. Today we’re going to look at two of these four strategies, and looking at combining them with an actual stock position that you may have in your account. So our first strategy is buying a protective put. If we buy a put, that allows us the right to put stock to somebody at a specific price over the life of the option contract. Let’s talk about that strategy first. Let’s say we have stock XYZ, it’s trading at $65.00, we own a hundred shares, we are going to buy that at $65 to make life simple, and we’re going to look at buying the 46-day, $62.50 put. This means that if we did this entire trade, that put adds an additional cost to the trade. The total cost is a net debit of $66.50, and the commission is $10.55 on the TradeKing platform. Now let’s fast forward to expiration and say, okay, we bought the put. If we had bought the stock, we’d have substantial downside, from $65 on down, but unlimited upside, whereas if we buy the put, what’s our risk, what’s involved with it? First of all, we didn’t buy the $65 strike put, so we’ve got a little bit of risk before our strike is involved in this trade. At $65 to $62.50, which is the strike price on our put, we take on that risk. I like to call that risk the deductible — that’s $2.50 of risk that we have. Now, we also paid for it, right? So usually in the options market, if you paid for something you say, oh, the market didn’t work, oh, that’s okay, we’ll give you your money back. No, that doesn’t happen, that’s a cost of doing business. So we’ve got a $2.50 deductible, plus the $1.50 that we paid, so total, our overall risk on this trade for the next 46 days is about 6%. Now, let’s look at the cost of the trade. If XYZ is above $65 at expiration, we’re not out of the water, right, because we’ve increased our cost basis. So we actually have to look at where our break-even is at. The break-even is $65, plus that $1.50, or $66.50. If the stock finishes at expiration anywhere below that, losses will occur. All right, that’s a protective put option. If I look at the profit and loss graph of it and we fast-forward to the expiration date of that option contract, on the x axis we see the stock at expiration; on the y axis, the up and down axis, we see the profit and loss of the position. Okay, if we’d just bought the stock, we have unlimited upside, substantial downside. If we buy the protective put, we have a limited and known downside on that position, but, we have still the substantial upside. Here’s the reason, though: we get rid of that downside, that means we’ve got additional costs. Our break-even becomes $66.50, we add another $1.50 before we cross that x axis at that break-even point, and that’s our tradeoff. A lot of people who look at this strategy would say: I don’t want a 46-day put; I’m more worried about the longer-term on this position. So let’s look at that: In our example we have a 46-day, $62.50 put trading for a $1.50. If you wanted protection for the entire year, let’s do the math on the overall risk if we were to buy this put for protection. The $1.50 cost is 2.3% of the investment in the stock. If we add in the deductible, which is the difference from the current market price, which is $65, to the strike price, which is $62.50, there’s an additional $2.50 of risk for a total risk of $4, or about 6.1% of the $65 investment in the stock. Many protective put buyers like to keep this downside risk somewhere in the 5-6% range. Now, I grabbed an option contract on this fictitious stock, but it was a real-priced option that had 292 days remaining to expiration, and that was trading for $4.60. You say, well, that’s not too bad. But if you start doing the math and you look at it, you see that $4.60 in cost alone is 7% of the underlying asset, at $65. Also, we’re not buying the $65 strike, right, we’re buying the $62.50 strike, which means we have that little thing called a deductible that we’ve got to add in, that adds a little bit more risk, so $4.60 plus the deductible at $2.50 is $7.10. If we add all that risk in, you’re looking at 10.9% of the total cost of the investment. A lot of people do that math and they say: I’ll just take the risk. I’ll sell it if it goes down 10%, that’s how I’ll try to get out of it. So, there’s our dilemma, there’s our issue. How are we going to solve it? The answer is, we’re going to do something that’s called a collar, and this is where we actually combine the second half of this trade. Instead of just buying the put outright, we’re actually going to look at selling a call and bringing in cash, and we’re hoping that we bring in enough cash that it helps decrease or greatly reduce the cost of the put, if not cover it totally. But, if we sell a call option, we’re going to be giving up some upside, that’s the tradeoff. So let’s look at what a collar would be. The stock’s at $65, XYZ stock’s trading at $65, we’re going to buy the $62.50 put, but we’re going to buy the long one, we’re going to buy the 292-day put, and that cost is fairly expensive, and then we go on and we look at the call option and we’re going to actually sell one 292-day, $72.50 call. Now, the total cost of the put and the call combined is only a net debit of twenty cents — the put was $4.60, the call brought in $4.40, so now we’ve gone from a $4.60 debit to have this type of risk on the downside to actually having a debit of twenty cents. So the total cost of the entire collar position is $65.20. Don’t forget, in this example we’re buying the stock along with the options. It’s not considered a collar without the stock position. The concept for the name of the strategy is that we’re collaring a stock position. The commission to do the entire trade would be $16.15 on the TradeKing platform. But let’s fast forward and look at our risk. Okay, we’re at expiration, we stand this entire trade, we put it on, we don’t worry about it, we wake up 292 days later and we look. Okay, what happened, what was our risk/reward potential? Well the risk is, from $65, minus the strike, $2.50, plus we went in and we paid that twenty cent debit so we’ve got to add that in, that’s total risk too — it’s only $2.70 over this time period, or about 4.1%. Now, we had to give something up to reduce that overall risk, and that is upside. The upside is $72.50 minus $65, or $7.50, minus the twenty cents that we brought in, because we paid for it, it comes away from our gain, and that’s $7.30, or 11% upside. So, why would we have so much more upside as opposed to the downside on a trade like this? And the answer lies in three little words: cost of carry. There is an interest rate factor that get figured into the call, that doesn’t get figured into the put, because of this cost of carry thing. It’s a little bit advanced so I don’t have time to get into it today, but if you’d like to learn more, obviously you can check out my blog, the Options Guy blog on tradeking.com, or go into our Learning Center, there’s a lot of information about it. But bottom line is, this going to the be the case on most longer-term options most of the time, where you’re going to be able to get a little bit more upside, and almost sell the call for the same price of the put. So let’s look at the profit and loss graph. We’re going to buy one hundred shares of XYZ stock. At one hundred, we’re buying the $62.50 put option, which we see here in this situation as the green line, and if we did the covered call. we actually see that that is the dashed red line. Now we combine all this, and guess what this looks like: we have long stock at $65, unlimited upside, substantial downside, but if we actually do the collar, we’re actually very similar through the meat of the trade, which the meat of the trade is between the strike prices, between $62.50 and $72.50. The only real difference in this area is where we cross the x axis, or the break-even point for the entire collar. If you’d like to learn more about these topics, please check out our Learning Center on tradeking.com. Also you can find answers to your questions inside our Trader Network, where many traders like to share tips and talk about where the marketplace is going to next. I’ve also authored The Options Playbook, which available for purchase on amazon.com, and you can actually view it online for free at OptionsPlaybook.com. If you’d like to hear more about my thoughts and tips, check out my blog on our Trader Network — just look for the Options Guy.
You must Log In to post to this blog.

Not a member? Register Now to


