Trading with MACD
Post on: 16 Март, 2015 No Comment

As you know from the title, this article will be devoted to one of the most popular technical indicators – MACD indicator. Most of the mechanical (indicator) trading systems are constructed on the basis of this indicator. Why is this indicator very popular among traders?
MACD is an abbreviation of Moving Average Convergence Divergence. Having read only one name, we understand that moving averages are included in this indicator’s basis.
This indicator refers to the class of oscillators, but its main task is to determine the trend. But also as an oscillator, MACD can show us a possible entry point in the market.
MACD signals
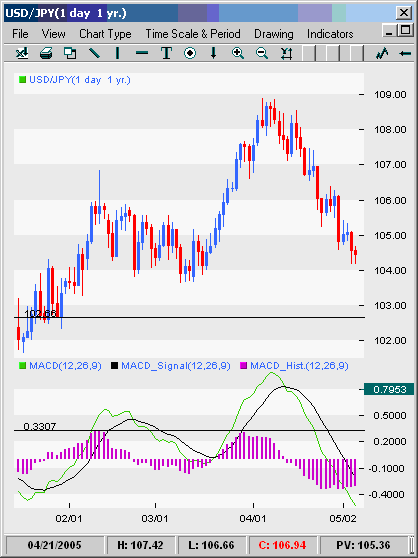
1. Trend detection. If MACD is above zero line and the bars’ peaks in the histogram rise, then the market is now under bullish trend. For the bearish trend – the situation should be reversed. Such a concept of trend detection on daily bars proposed A. Elder (Three screens strategy).
2. Local maxima or minima formation in MACD-Histogram (current maximum histogram bar closes below/above the previous bar) indicates that current movement is ended and the market either goes into a correction or reverses.
But it is important to remember – in order to make the market turned, something more than just reading some indicator should happened.
3. Cavities formation. In some ways a continuation of the previous signal when, for example, the histogram is generated a maximum, then the bars begin to drop, after that there is a bar with a maximum above the previous bar and MACD crossing zero line does not occur. In this case, we can assume that this movement was corrective and it was over. This signal is weak and gives a lot of false entries in a sideways motion.
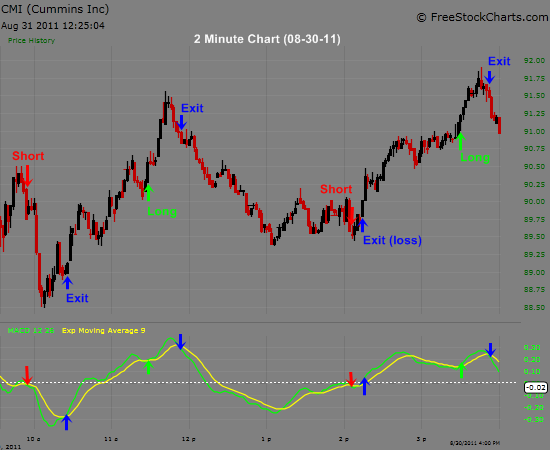
4. MACD crosses zero line. This is equivalent to moving average. If MACD crosses the line from top to bottom, this is a signal to sell. If it crosses from the bottom to up – this is buy signal. Many sources write that this signal is the strongest of all signals that can be obtained from MACD indicator.

5. Divergence. Divergence formed when the price reaches a new high, but the corresponding maximum of MACD is not higher that the previous, or when the price reaches a new low, but the corresponding minimum on MACD is not lower than the previous.
Disadvantages of the MACD indicator
MACD has the same disadvantages as moving averages. It has serious lags in trends and gives a lot of false signals in lateral movements.
Naturally, MACD as well as most technical indicators, designed for analysis on high timeframes. In the lower time frames they are not working good. By the way, the parameters 12-26-9 originally designed for daily charts and in order to trade other timeframes, it is necessary to customize options as appropriate for the time period and currency pair.
At the end of this article, I would like to remind you that the signals of any indicator should only be as acknowledge of your guess. Let’s look for major signals in technical analysis, news, candlestick patterns, etc. It is very important.


