Trade Binary Options Using Trend Continuation Patterns
Post on: 23 Апрель, 2015 No Comment

A trend is underway and youre looking for entry point. All of a sudden the trend pauses or pulls back, leaving you with the question: Is this thing going to keep trending eventually, or is this a full reversal? While there is no way to know for certain, being aware of continuation patterns can help. At minimum these patterns provide you with trade signals to get into potentially profitable trades. Continuation patterns occur during a trend, and signal that the trend will continue once the pattern completes. This doesnt always happen though. Therefore, when using these patterns to trade, dont assume the breakout direction of the pattern before it occurs. Wait for the price to break out of the pattern, and trade in the breakout direction.
Triangles
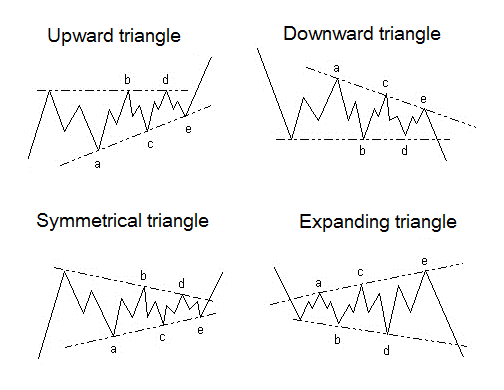
Triangles come in three forms, descending, ascending and symmetric, but for trading purposes theres no real difference except for how they look. All triangles are created by narrowing price action, so when you draw a border around it, it looks like a triangle.
Figure 1 shows a symmetric triangle, as the lines converge toward each other. With an ascending triangle, the upper line is horizontal, and the bottom line ascends toward it. With a descending triangle, the lower line is horizontal and the upper line descends toward it.
Figure 1. GBP/USD Daily Chart
Source: Oanada MetaTrader
Go long or buy calls when the price passes above the upper border as it does in Figure 1. If the price would have broken below the lower border, youd enter short or buy puts.
A daily chart is used in this example, the same concept can be applied to other time frames though, such as a 1, 5, 15 minute or hourly chart.
It is common (in my experience, it happens about 50%of the time) for the price to re-test the breakout area after the breakout. Notice how the price moves back toward the green breakout linemarked Pullback on the chart after having broken out. Time options trades to accommodate for this. Alternatively, you can wait for this pullback to occur, and then enter a trade when the pullback bounces off the former triangle as it did in Figure 1.
Flags and Pennants
These formations get their name from a sharp price move, the pole, followed by either a small channel like correction which looks like a flag, or a small triangle which looks like a pennant. Theres little difference between the two patterns, except a slight difference in appearance. Pennants have converging price action similar to triangles discussed in the prior section. For trading purposes, the method for trading them is the same.
Figure 2 shows a pennant occurring in a move higher, and two flags occurring during a decline. Go long or buy calls when the price breaks higher out of a flag/pennant and the pole is up. Sell or buy puts when the price breaks below a flag/pennant and the pole is down.
Whether these formations occur on a daily chart, or a 5 minute chart, it is typically explosive. Trades generally do not last very long. Trade the breakout and look for another set-up. You simply want to take advantage of any remaining momentum left after the sharp move and a pause. The flag/pennant portion of the formation is typically about 4 to 8 bars. Draw the pattern once 4 bars of price data are present (not including the pole). If you draw it before this, you are more likely to get false breakout signals.

Figure 2. GBP/USD 5 Minute Chart
Source: Oanda MetaTrader
Things to Note
Spotting and drawing chart patterns will always be someone subjective. For example, if we were to compare trades, my breakout price may be a bit different than your breakout price just because there is a slight discrepancy in where we put our lines. Dont be overly concerned about this. The real world rarely provides markets that move within exact confines. For this reason, Ill usually wait till a currency moves a couple pips beyond my breakout point before making a trade. In the case of a stock, Ill wait for the price to move a couple cents beyond the breakout point before making a binary option trade.
Final Word
Continuation patterns which include triangles, flags and pennants occur quite often on all time frames. Triangles require some patience to allow the pattern to form, and ultimately for the price to breakout. Pennants and flags generally occur quickly and are seen in fast moving markets, so youll need to be on the ball to catch the breakouts. Chart patterns are always somewhat subjective. You may see a pattern someone else doesnt, or draw a pattern slightly different than they would. Before you commit money to trading these patterns take some time to practice spotting, drawing and trading them in a demo account . You may also want to check out my recent article on Trading Trend Reversal Price Patterns .


