Top 5 Useful Trading Tools and Indicators for Binary Options
Post on: 11 Сентябрь, 2015 No Comment

Useful Tools and Indicators For Binary Options Traders By the Geek!
There are a lot tools for traders. Some are useful for binary options, some more useful than others. Of them all there are a few basic tools that every binary options trader should employ. Read more to find out what the are
Out of all the tools, types of tools, styles of tools, custom tools and other resources for binary traders I have been asked to pull together what I think are the top 5. This was a hard question and one that needed time to answer. There are too many tools, good tools, for any one list to truly be the “top” but I was able to narrow down the list to a handful I think every binary options traders should be using (No particular order).
Candlesticks Catching the Signals
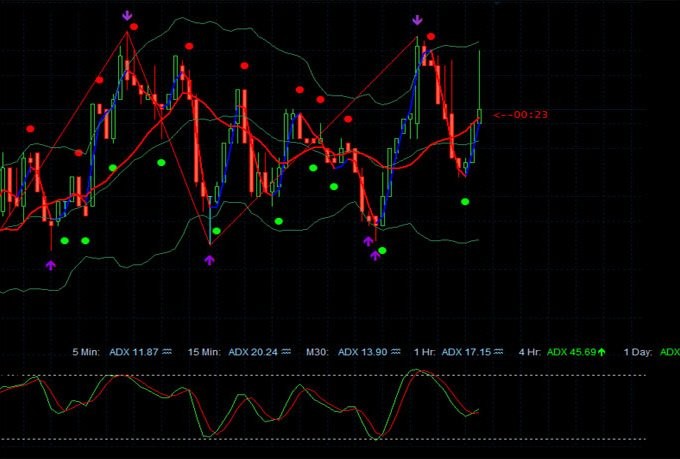
Candlesticks, or Japanese Candlesticks. are one of many ways to view price charts. Candlestick charts dont depict different data, they depict the same data in a different way. Candlesticks refer to the manner in which each days prices are displayed. Unlike a bar chart that only shows a stick figure of prices Candlestick charts show a much easier to read cartoon like drawing of prices. Up days are white, down days are black. If you have seen a candlestick chart you know what I mean, if you havent you will understand as soon as you do.
Not only are candlesticks much easier to read than bar and mountain charts the signals are easier to read too. The easy to read candles with their black and white coloring make it easy to see patterns as they develop and get a better grasp of price direction. Candlesticks can deliver signals on their own but come into full service when confirming some other indicator.
Oscillators Technical Calling
Oscillators are an important part of technical analysis and binary options trading. The term oscillator refers to a type of indicator and not a specific tool. I choose to include this as a category because there are dozens of useful and trustworthy oscillators out there. Basically, oscillators are a tool that displays a line when charted that fluctuates between two extremes. The extremes could be 0 and 1, 0 and 100, + or – 1, or some other range. Some popular oscillators include RSI, MACD, Stochastic and the Awesome Oscillator.
Oscillators come in many forms but all seek to do the same thing, generate signals. The best oscillators will provide several different kinds of signals and can be used in a variety of ways. I use two different oscillators. I use MACD as a momentum indicator. It measures the distance of convergence/divergence between two moving averages. I also use stochastic, an indicator based on random walk theory. Together these indicators help me to judge market strength, direction and areas of support and resistance.
Trend Lines No Need to Explain
Trend lines are one of the most basic forms of technical analysis. A trend line connects peaks and troughs of different levels in a way that allows traders to judge market direction. Trend analysis lies at the very core of all technical analysis. Trends exists in every time frame, drawing trend lines on different time length charts is one of the best ways I know to weed out false signals. Trading with the trend is one of the oldest and well known adages from the trading world and one that I embrace wholeheartedly.
Support and Resistance Ups and Downs
Are another important type of line you can draw on your charts. These lines connect peaks and troughs of the SAME height or level as well as any other area of significance. This could be an all time high, a consolidation band or a continuation signal. These lines provides good estimates of where corrections may end and rallys may fizzle out. Having a good grasp of support and resistance can be a tremendous asset when choosing market stance and expiries for options. I love support and resistance lines because they are a form of market memory. I may not remember what happened on a given day for a given top/bottom or consolidation to form but the market remembers those prices. It is uncanny how a line I drew one, two, three or more years ago can provide a turning point for the market today.


