The Psychology Of Support And Resistance Zones
Post on: 16 Март, 2015 No Comment

The Psychology Of Support And Resistance Zones
Article Highlights
Human emotion and behavior are largely responsible for action in the markets.
Herd instinct is seen when traders congregrate near support and resistance levels.
Technical analysts use support and resistance to identify points on a chart where the probabilities favor a pause, or reversal, of a prevailing trend. Support occurs where a downtrend is expected to pause, due to a concentration of demand. Resistance occurs where an uptrend is expected to pause temporarily, due to a concentration of supply. The article Interpreting Support and Resistance Zones examines the basics of this technical analysis tool. This article will examine how support and resistance zones are largely shaped by human emotion and psychology. (Every time an investor talks about getting in low or picking entry and exit points, they are paying homage to these men. See The Pioneers Of Technical Analysis .)
Tutorial: Elliott Wave Trading Strategies
The Psychology of Support and Resistance
In a financial market, there are three types of participants, at any given price level:

As price rises from a support level, the traders who are long are happy and may consider adding to their positions if price drops back down to the same support level. The traders who are short in this situation are beginning to question their positions, and may buy to cover (exit the position) to get out at, or near, breakeven, if price reaches the support level again. The traders who did not enter the market previously at this price level, may be ready to pounce and go long, if price comes back down to the support level. In essence, a large number of traders may be eagerly waiting to buy at this level, adding to its strength as an area of support. If all these participants do buy at this level, price will likely rebound from the support once again.
Price can, however, fall right through the support level. As price continues to drop, traders will quickly realize that the support level is not holding. The long traders may wait for price to climb back up to the previous support level, which will now act as resistance, to exit their trades in the hopes of limiting their losses. The short traders are now happy and may consider adding to their positions, if price revisits the price level. Lastly, the traders who did not enter the market yet may go short, if price comes back to the previous support level, in anticipation of price dropping further. Again, a large number of traders may be ready to make a move at this level, but now instead of buying, they will be selling. This same behavior can be witnessed in reverse with traders’ reactions to resistance levels.
Shifting Zones
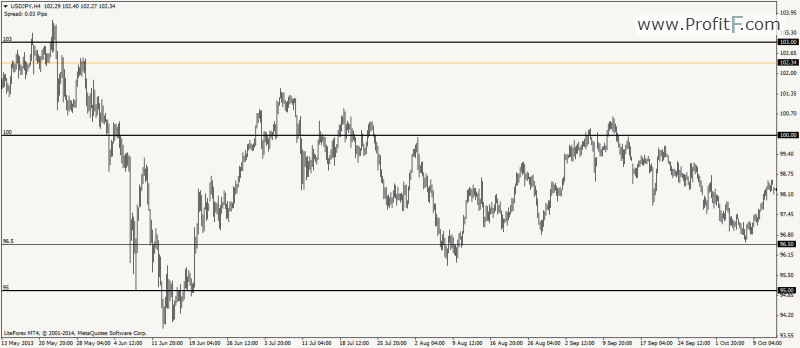
These examples illustrate an important technical analysis principle: what previously acted as support will eventually become resistance. Conversely, levels that formed resistance will act as support, once price breaks above the resistance level. This can be seen on any chart or any time frame. Though investors commonly refer to daily charts to determine areas of support and resistance, smaller time frames are also used, especially by short-term traders, to establish these areas. Figure 1, for example, shows a 15-minute price chart of Coca-Cola (NYSE:KO). The yellow line represents a price level ($67.60) that has flip-flopped between acting as resistance and support, and back to resistance.


