Technical Heikin Ashi Candlestick Indicator Strategy
Post on: 22 Апрель, 2015 No Comment

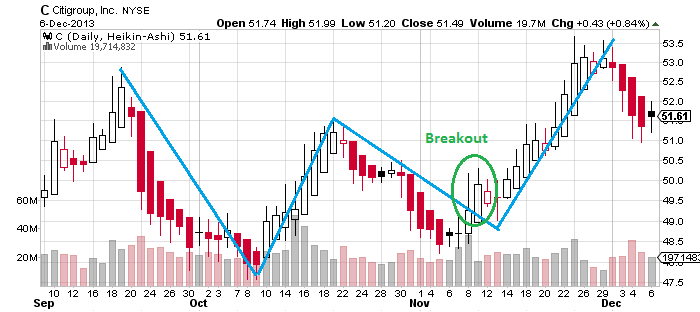
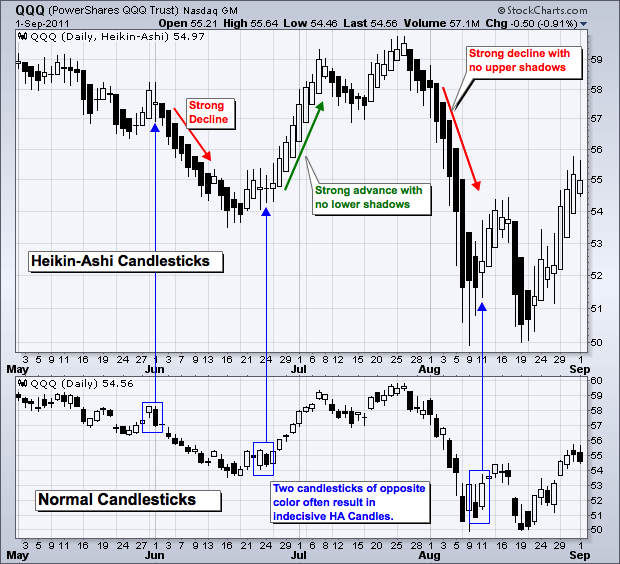
Heikin Ashi candlesticks can be an extremely helpful tool when performing technical analysis for binary options trades. Although they appear similar to any other candlesticks within a chart, the calculations that are applied are not the same. Conventional candlesticks are a bit limiting because they only reveal opening/closing and high/low prices. Heikin Ashi candles are different in that they are marked on technical charts in relation to the past price movement. Their primary function is that of providing traders with a clear picture of how an asset price is moving.
Market noise often leads to losses, as too much clutter within charts can cause traders to overlook opportunities out of fear that the asset price may reverse direction. Heikin Ashi candles help to filter out this noise, making it easier to get to the root of price action. In doing so, trends will be easier to identify at an early point, as will the potential for an upcoming reversal. Basic use will include taking a Call trade when a bullish candle closes, or a Put trade when a bearish candle closes. Simple enough, but there is a bit more to consider.
Calculation averages are used, so Heikin Ashi is somewhat of a lagging indicator. This isnt necessarily a bad thing, as some lag can prevent early exit from the market. These candles clearly display movement, allowing traders to push emotions aside and enter into a trade based upon facts and data rather than feelings. So long as the candles continue to remain a specific color, (more on this below) trader can rest assured that the price is headed in the indicated direction and can trade accordingly.

The calculations performed by this indicator will be done for you when using a high quality technical chart. If you wish to use this binary options strategy, youll have to select a charting package that offers the Heikin Ashi indicator. Although each technical chart will vary in its use, it should be possible to select this indicator and have the associated price chart load with just a click or two. There are plenty of free charting packages available online, some of which can be used from a web browser, and some of which will need to be downloaded and installed on your computer.
Now, more on the color of these candles. Each trade decision will be based upon the color of the candles. Blue will go along with a Call signal, while red will go along with a Put signal. While the colors remain, it will be possible to trade along with the trend for a period of time. Once the color changes, it may then be possible to trade along with the reversal. This is one of the hallmarks of a great binary options strategy the ability to use it to trade on more than one type of price action.
This Heikin Ashi strategy will be even more effective if another form of verification is used. For example, support and resistance lines which can show when an asset is being overbought or oversold. Keep in mind that when traditional candlesticks are not showing a clear direction, Heikin Ashi candlesticks may do so. No binary options trade should be based upon a single indicator, so do take the time to validate market entry by viewing various other indicators.


