Strategy Series Part 6 Trend Trading with ADX
Post on: 15 Сентябрь, 2016 No Comment

Talking Points.
- ADX can pinpoint strong currency trends RSI can be used to enter with market momentum Risk Management can use previous market highs and lows
Trading trends is always a popular market approach, with traders looking to take advantage of directional markets. However it can be difficult to not only find but also time entries into those trends. To help with this process, we will continue our conversation on strategies, by reviewing the ADX 50 trend trading strategy. Lets get started!
Not a position trader? In our previous strategy session, we reviewed day trading intraday market reversals with the DT Pivot strategy. Learn more using the link below.
Learn Forex EURUSD 4Hour with ADX
(Created using FXCMs Marketscope 2.0 charts )
ADX and the Trend
Finding a strong directional move is the first priority of any trend trader. However, when having to select a currency pair to trade, it can be difficult to identify the best trends. For the ADX 50strategy we will be using the ADX (Average Directional Index) indicator for this process. First, add a 14 period ADX to the 4Hour chart, using Daily periods. This can be accomplished through the data source options found in the properties menu. Ultimately, this will show us a Daily ADX reading on the 4Hour graph as depicted above.
Remember, ADX is not identifying the direction of the trend, only its intensity. If a currency pairs trend is weak or if the pair is consolidating, ADX will read significantly lower than a strong directional market. For the ADX 50 strategy, we will only be looking for currency pairs with an ADX value of over 50! If Daily ADX reads over 50, you can then begin to move to the execution phase of the strategy.
Learn Forex EURUSD with ADX and RSI for Entries
(Created using FXCMs Marketscope 2.0 charts)

Trending Entries with RSI
Once a strong trend is found, it is time to plan an entry into the market. The ADX 50 trend trading strategy uses an RSI (Relative Strength Index) indicator signal for this task. For todays entry signal we will be using an RSI with a 14 period setting on a 4Hour chart. In a downtrend, new sell positions should be entered only when ADX reads over 50 and RSI closes below 30 (oversold). Conversely buy positions will be initiates when ADX reads over 50 and RSI closes above 70.
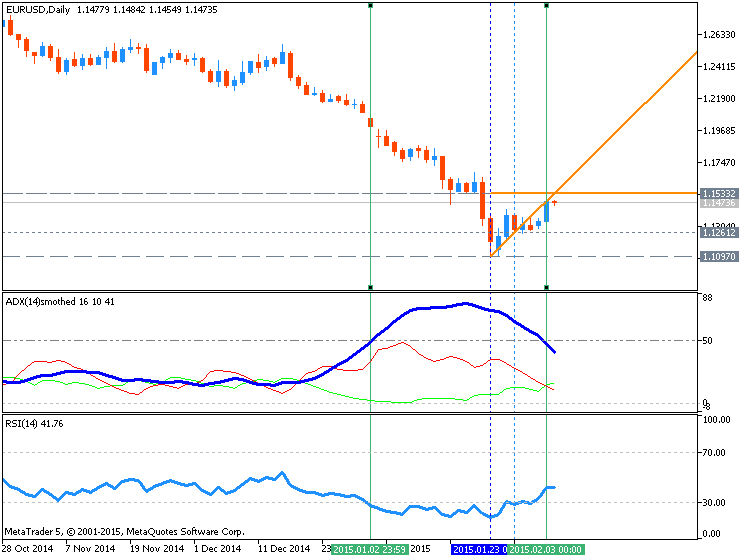
Below we see a sample EURUSD chart, which has been filtered for ADX. As ADX rises above50. traders can begin executing sell signals as RSI closes below 30. So far. during the highlighted period, RSI has signaled 3 sample entries for the graph. As ADX is now below 50, no new trading signals should be considered.
RSI is an important component to this strategy! Before you get started with the ADX 50 strategy, sign up and take the FREE DailyFX RSI training course linked below.
Stop and Limit Placement
Traders should always have a plan for managing their position. Eventually trends will come to an end and any existing trades should be exited. When initiating a buy order, stop orders should be placed at a 14 period low on the 4Hour chart. That way if a new low is created, all existing buy trades will be closed. Conversely if a trader is selling in a downtrend, stops can be placed at a 14 period high again using the 4Hour chart.
When it comes to profit targets, the ADX 50 trend trading strategy will use a standard 1-2 Risk:Reward ratio. This means that your limit placement should look for twice the amount of pips relative to your stop. For example, if a sample trade has a 100 pip stop loss, a minimum 200 pip profit target is suggested.
Learn More
The ADX 50 trend trading strategy is just one installment of an ongoing article series on market strategies. If you missed one of the previously mentioned strategies, dont worry! You can catch up on all of the action with the previous articles linked below.


