Scalping and Intraday Trading (MT4) Indicator
Post on: 11 Июнь, 2015 No Comment

How to trade
Extremely simple, yet useful for beginner or seasoned traders.
Scalping in a nutshell
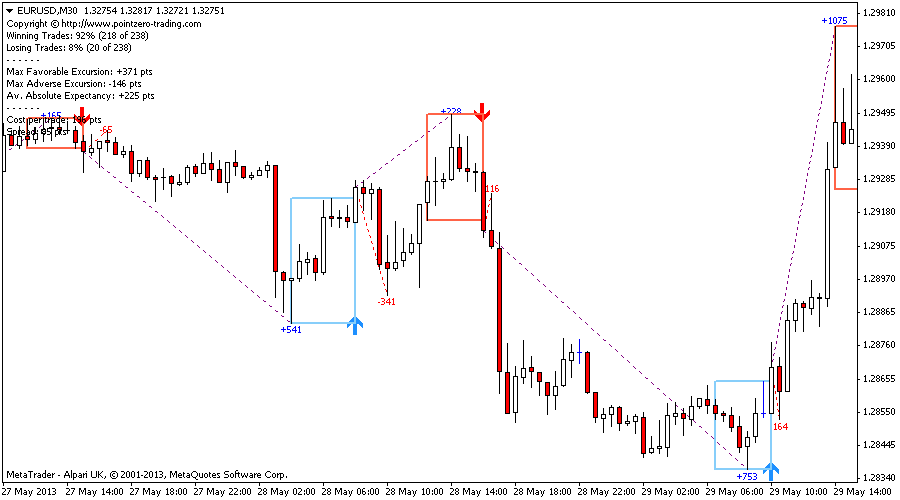
The PZ Day Trading is a very complex indicator that relies on variable length breakouts and congestion zones on donchian peaks or bottoms, but it keeps the nitty-gritty stuff for itself. All you need to know to trade it is the following.
- A blue arrow is a bullish formation and you should buy
- A red arrow is a bearish formation and you should sell
Sometimes you will bump into losing trades, which are almost always caused by sudden spike bars with long wicks against the trade direction. Because volatility decreases as you go up in timeframes, trading H1 and H4 charts will yield the best results.
How to interpret the stats
The indicator studies the quality of its own signals and plots the relative information on the chart. Every trade is analyzed and the overall historic results displayed at the top-left corner of the chart.
Maximum Favorable Excursion (MFE) The MFE is the best possible outcome for any given trade.
The average MFE is displayed at the top-left corner of the chart. Maximum Adverse Excursion (MAE) The MAE is the worst possible outcome for any given trade.
The average MAE is displayed at the top-left corner of the chart. Average Absolute Expectancy (AAE) The AAE is the absolute excursion you can expect for any given trade, obtained by subtracting the MAE from the MFE, which reflects the true quality of the entry strategy. In other words, the entry strategy is measured by the relationship between the average best possible outcome and the average worst possible outcome.
The indicator displays the best possible outcome and the worst possible outcome for every trade using two dotted lines and two price labels, and account every single one of them into the statistics you can find at the top-left corner of the chart. You can use those statistics to optimize the indicator parameters by yourself, for any given instrument and timeframe.
Finally, losing trades are not hidden but highlighted and accounted. Every losing trade is highlighted with a red cross. Looking at them regularly might help you to avoid losing patterns in the future.

Watch the video!
Take a look at the video, in which I explain how does the indicator work, how to optimize it, how to trade it and how to avoid losing trades.
Timeframe selection is key
Most brokers lure novice traders into scalping small timeframes, with the implicit argument that more trading frequency translates into more profits. But nothing can be further from the truth. Most traders don’t lose their bankroll to the market, but to the broker, and end up asking themselves what went wrong.
If you pick the wrong timeframe without doing the math, you can lose money regardless of how good you are trading! Make sure to read why most intraday traders fail to select a timeframe wisely, before starting your trading activity.
Keep always an eye at the relationship between the Average Absolute Excursion (AAE) and the Cost per trade. to avoid trading timeframes in which the mathematical expectation of your trading is negative.
If you are a novice trader, you should seriously consider trading daily charts or H4 charts, in which the transaction costs are reduced to a minimum in relationship with the potential profits. With just a little patience, you can obtain exceptional returns .
Settings
The indicator parameters
When loading the indicator to any chart, you will be presented with a set of options as input parameters. Don’t despair if you think they are too many, because parameters are grouped into self-explanatory blocks. This is what each parameter does.


