Relative strength index ( RSI )
Post on: 27 Июнь, 2015 No Comment

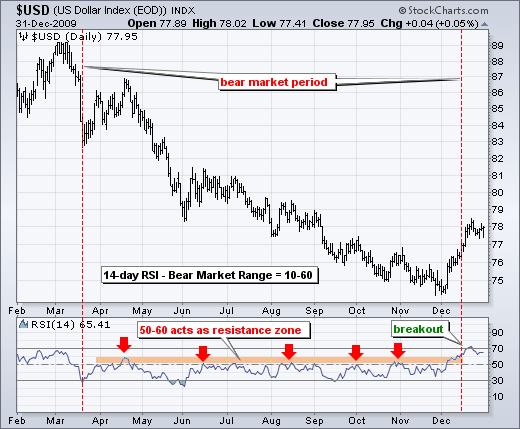
The Relative Strength Index, or RSI, is a leading indicator, in that it can predict a stock’s price movement before it happens. This is because the RSI is a momentum indicator, and indicates overbought (price is too high) and oversold (price is too low) conditions. In overbought conditions, the price of the stock is bound to retreat and stabilize in the near future. Similarly with oversold conditions.
Whereas moving averages are based on a stock’s closing price, the RSI is based on gains and losses. Basically, the number and size of gains and losses are used to calculate the relative strength for a particular period, say a 14-Day period. Subsequent relative strengths are then used to plot the RSI chart.
The RSI is an oscillating indicator, fluctuating between 0 and 100, where 0 is the most oversold, and 100 is the most overbought. 50 is the centerline. Anything above 70 is considered overbought, and anything below 30 is considered oversold. While this 70/30 levels are more common, some investors do use 75/25 or even 80/20 levels to mark overbought and oversold conditions. These levels will confirm overbought or oversold conditions much better, but are less sensitive to normal price movements. For example, a stock in a trading range might never hit the 80 or 20 levels, and we will miss out on all signals.
While the RSI can tell us when a stock is overbought or oversold, its true value is its ability to indicate when the stock is coming out of overbought or oversold conditions, ie. when the stock is going to move back towards the moving average. So the points to watch are those when the RSI moves below 70 from above, or moves above 30 from below.
In the chart above, the RSI crossed below 70 in March, and again in June. It also crossed above 30 in May. Therefore, we would implement bearish strategies in March and June, and bullish strategies in May.
Note that the RSI produced signals days (even more than a week) before the 20-Day EMA did in the chart above. This is due to the fact that the RSI, being a momentum indicator, is a leading indicator and can predict price movement before it happens.
However, this might not be a good thing, as can be seen in March. The RSI produced a bearish signal a month before the actual downturn happened. In the world of options trading, a month is a long time.
The RSI is a momentum. oscillating and leading indicator. It is used to indicate when a stock comes off its overbought or oversold conditions. A stock is overbought at RSI values above 70. and oversold at values below 30 .
Similar to the MACD, we can also plot positive and negative divergences with the RSI. A positive divergence is when the RSI makes valleys or troughs that get higher and higher, and indicates a potential upturn. A negative divergence is when the RSI creates peaks that become gradually lower, and indicates a potential downturn.
For example, in the chart below, the RSI formed a negative divergence in January 2004. This is despite the fact that the actual stock price was making higher peaks. Sure enough, the negative divergence correctly predicted a sharp price drop in early February.
If we extrapolate further, we can see that after January, the RSI was forming lower and lower peaks all the way till June. This is a very bearish sign.
We have only touched on a few of the basic techniques involving RSI. There are other methods of reading RSI charts, and are beyond the scope of this guide.
The RSI can also contain positive and negative divergence patterns. A positive divergence predicts future upturns. while a negative divergence predcits future downturns .


