Relative Strength Index and Its FailureSwing Points Forex Market Analysis
Post on: 16 Март, 2015 No Comment

Relative Strength Index and Its Failure-Swing Points
J. Willes Wilder Jr. explains the relative strength index (RSI) in great detail in his book, New Concepts in Technical Trading Systems . Over the years, chartists and technicians alike have written volumes about the RSI, which has been categorized as an overbought/oversold indicator. In this article I am going to follow the writing of Wilder and his theory of RSI as it applies to a high-profile issue in both the United States and Canada.
For those who are not familiar with the relative strength index, it is an oscillator, and its values move between 100 and 0. The number of days in a given time period where the stock price is up is compared to the number of days the price is down. Wilder uses 14 days in his studies and this number of trading sessions is still commonly used today. The well-known formula for RSI is as follows:
RSI =100-100/(1+RS)
RS = Average of x days up closes / Average of x days down closes
Increasing values will be shown with a sharp rising line, moving above the 50 and rising toward 100. Conversely, falling values will see the same line falling toward the 0 value. When the RSI value rises above the 70 value, technicians consider the issue to be overbought. When the RSI value sinks below the 30 value, the issue is thought to be oversold.
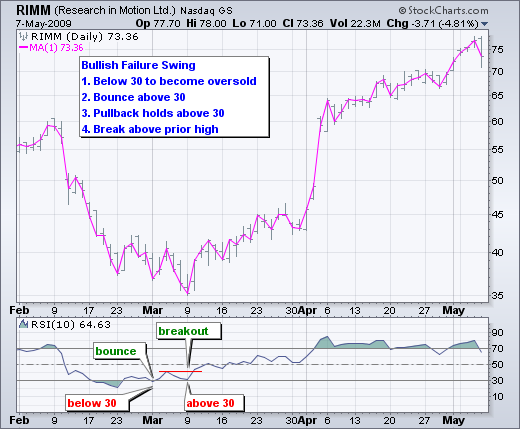
Even one step further is the failure swing, a term that Wilder uses to refer to very strong indications of a market reversal. Wilder uses failure swings to confirm his buy and sell points, and in the two figures below you can see that failure-swing points clearly do just that.
In the left figure, entitled Failure Swing: Top, the high tops out at slightly above the 70 level and then falls off to about 60, which is known as the fail point. Rising again, the RSI value falls short of the 70 mark and thus results in a failure swing, and, as the value then reaches the fail point again, it is known as the failure-swing point, and the sell trigger is pulled. Failure Swing: Bottom shows us the exact opposite as the low of 30 is not exceeded after a fail point is established at about the 40 mark. The failure-swing point is established and the buy signal is in place at or about the 40 value.
With that little bit of a background lessen taken care of, lets have a look at a chart of the Royal Bank of Canada (RY-NYSE) from the period of Jul 31, 2001, to Apr 21 2003.
With the help of the ellipses you can see that on Sept 21, 2001, the RSI value was 20.62 at the close of the trading day, and the Royal Banks stock price finished the session at $27.97, which gives an RSI value of 20.62 this is well below the magical number of 30. Fast forward to Feb 6, 2002, and the RSI value is 30.11 with the stock price at $29.58. Given the perfect vision of hindsight, we can see an investor entering the market at these levels would have been paid quite handsomely over a relatively short period of time; however, lets take a look at the third set of ellipses, at the $36.20 level on Apr 19, 2002, when the RSI value sat at 78.81.

Is it time to sell? Is the Royal Bank of Canada overbought at the 70 level? Maybe, but then again maybe not. Lets have a closer look. On Apr 19, 2002, the issue peaked out at 78.81, the highest RSI value in over 12 months, and the stock price closed at $36.20, a fairly large move from the level of about $28.00, which occurred back in late Sept 2001. This is not bad for a big bank that already pays a respectable dividend. To the question of selling, the answer would have been yes. Those who hit the sell button that day as the RSI value passed through the 70 level would have had their reaction confirmed later the next week when the high established on the 19th was not exceeded, and thus the failure swing resulted, whereby the sell point appeared again at the $35.50 level on May 3. (See the blue in the chart arrow)
In the third chart, July 26 is the date of failure swing confirmation as the low set on the 24th was not exceeded, and the stock price headed north one more time. One needs to understand that an issue can continue to fall off the table even after the value drops below 30; furthermore, investors need to confirm that the issue is strong enough to turn the corner and increase in price instead of continuing to lose stock value.
The key to successful trading when using the relative strength index is recognizing failure-swings points. In simpler terms, some have described a failure swing as purely a confirmation of the impending reversal in trend. Another point of interest is the move above and below the centerline of 50. Many technicians will look at a move above 50 as a representation of average gains surpassing average losses and thus of a bullish sentiment in the stock price. Conversely a level below 50 signals a bearish market as average losses have overtaken the average gains.
In the future, as you look very closely at the relative strength index, and before make a trading decision, be sure you recognize the failure-swing points and confirm the potential breakout.
By Investopedia Staff
This entry was posted on Thursday, August 3rd, 2006 at 22:56 and is filed under Articles. Books. You can follow any responses to this entry through the RSS 2.0 feed. Both comments and pings are currently closed.


