Price to Earnings (P
Post on: 22 Апрель, 2015 No Comment

- In general, a companys P/E ratio is its price per share divided by earnings per share; however there are multiple versions of earnings (trailing twelve months, forecasted twelve months, etc.) and multiple ways to decompose the ratio for analysis purposes.
P/E = Price per share / Earnings per share
Trailing P/E Issues
- Non-recurring items: Whenever looking at a companys trailing P/E ratio, analysts should revise earnings to exclude non-recurring items.
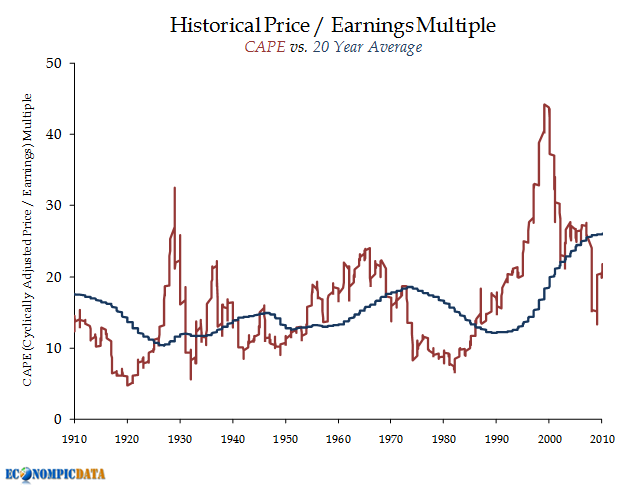
- Cyclical companies: Whenever analyzing companies whose earnings are highly sensitive to the business cycle, analysts need to normalize (or smooth) earnings; this can be done with average ROE, for example.
- Accounting practices: Analysts must be aware that a companys accounting may require revisions so that historical accrual based earnings reflect economic reality.
- Dilution: A companys stock may have dilutive exposure and basic EPS might not reflect the actual EPS that investors would see in the future as the number of shares outstanding could grow through exercised options, convertible securities, etc.

Leading P/E and Earnings Yield
Leading P/E
This ratio will reflect a companys future earnings, possibly the next fiscal year or next four quarters (if a company is in the middle of a fiscal year). A leading P/E can be in year as well, reflecting some portion of year to date earnings and forecasted earnings for the remainder of the year.
Gordon Growth Model (GGM) and Trailing P/E Ratio
- GGM can be used to show how variables influence trailing P/E.
P0 /E0 = (Dividend payout ratio (1 + Growth rate)) / (rce g)
GGM and Leading P/E Ratio
P/E to Growth Ratio (PEG Ratio)
More from this section


