Pivot Point Strategy
Post on: 16 Март, 2015 No Comment

March 3, 2014 By Mayfair Options
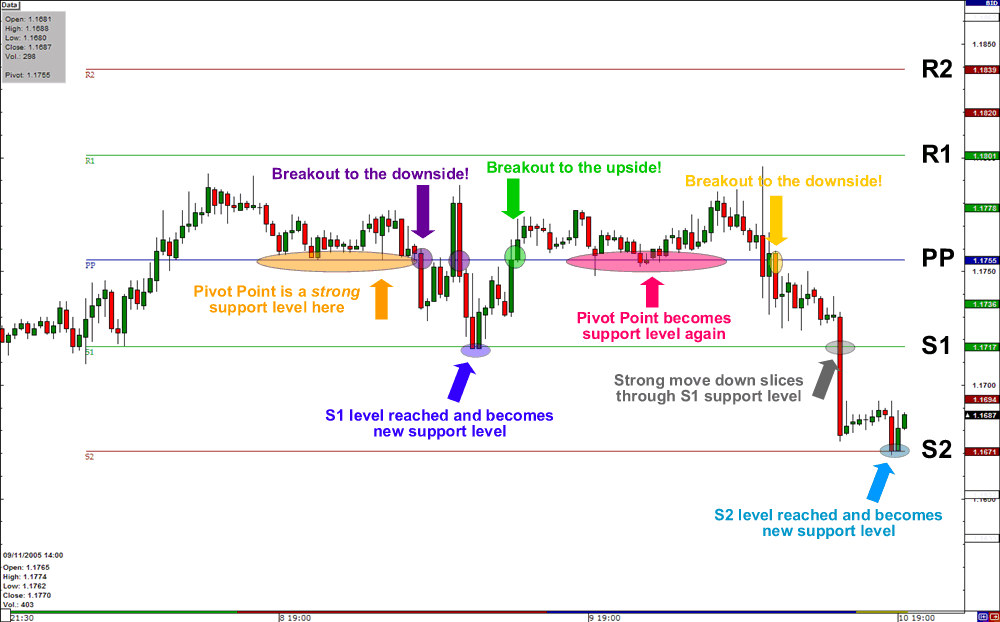
Pivot points are usually best detected via the use of a pivot point calculator. This tool helps traders to determine the upcoming direction of asset price movement, along with just how far up or down the price may go. These calculations are derived from the average price, and highest and lowest prices for a time period. Support and resistance are factored in to provide a solid prediction of movement.
You will need to use one of these calculators in order to execute this binary options strategy. The calculator settings will be marked at S1-3, central pivot, and R1-3. These setting can be used when trading binary options, as well as in other financial markets. Pivot point calculators can be found online, often for free and should compute and mark the pivot points for you automatically.
Pivot points will provide you with a reasonable indication of the asset price range, especially when you combine them with additional indicators. Traders can also use these points to spot trend reversals and breakout points. Another use would be to determine prime times for market entry, often just before a price correction or complete reversal in the direction of price movement. All of this information can be beneficial to the binary options trader.
How To Use the Pivot Point Strategy
Always remember that pivot points are import levels for the asset price. It will be within these levels that a price direction reversal could take place. The price could also pause, and then continue to move in its original direction. Since clear boundaries will be shown when using a pivot point calculator, consider using this strategy with the One Touch trades provided by Mayfair Options.
Asset price levels are going to show you both support and resistance. You should also be able to see areas for potential price reversals. Short-term changes can also be spotted. For example, if the asset price begins the trading day being higher than the middle pivot, the indication is bullish. If it opens higher than the second point, the asset is likely to be bullish for the long-term, but bearish for the short-term. Armed with this information, enter into each trade accordingly.
This binary options strategy is very simple and although it can be quite effective, it will be more effective if some additional method were used to verify the forecast. New traders can use this strategy, but should master the basics of their charting package first. After this is done, setting and viewing pivot points should be a simple task.


