Nifty Live Open Interest and PCR
Post on: 16 Март, 2015 No Comment

Nifty Intraday PCR Trend
Nifty Live Change in Open Interest Chart
BankNifty Live Open Interest Tracker
Nifty Daily Put Call Ratio Analysis
BankNifty Intraday PCR Trend
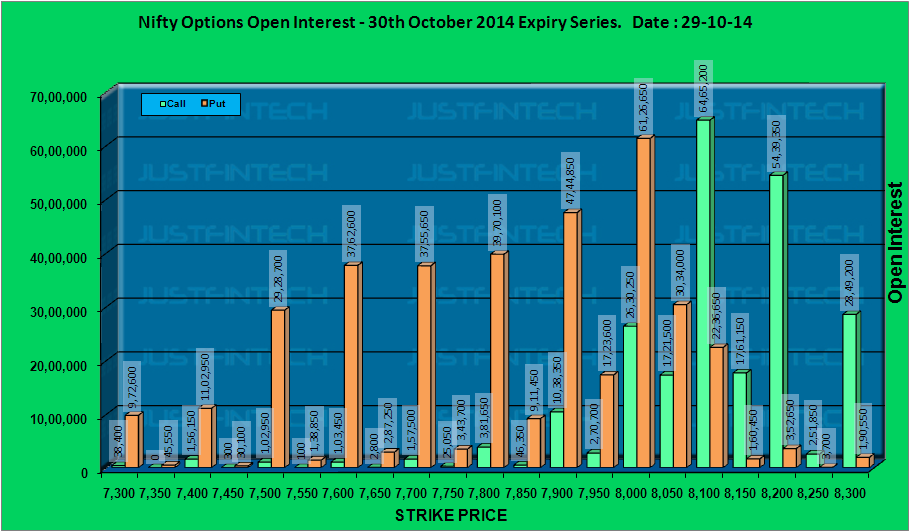
NIFTY OPEN INTEREST CHART LIVE:
How to interpret Nifty Open Interest Chart Live | Live Put Call Ratio Tracker?
In Summary: High PCR means the market is bullish because the option writers are inclined to write puts. Low PCR means bearish sentiment because option writers are not willing to write puts but instead write calls.
The put-call ratio (PCR) is a popular tool specifically designed to gauge the overall sentiment (mood) of the market. The ratio is calculated by dividing the number of traded put options by the number of traded call options. As this ratio increases, it can be interpreted to mean that the investors are putting their money into put options rather than call options. An increase in traded put options signals that investors are either starting to speculate that the market will move lower, or starting to hedge their portfolios in case of a sell-off.
Why should a trader bother about PCR?
The put-call ratio (PCR) is primarily used by traders as a contrarian indicator when the values reach relatively extreme levels. This means that many traders will consider a large ratio a sign of a buying opportunity because they believe that the market holds an unjustified bearish sentiment and it will adjust to normal soon, once the short covering begins. Unfortunately, there is no magic number that indicates that the market has created a bottom or a top, but generally traders will anticipate this by looking for spikes in the ratio or for when the ratio reaches levels that are outside of the normal trading range.
An increasing ratio is a clear indication that investors are starting to move toward instruments that gain when prices decline rather than when they rise. Since the number of call options is found in the denominator of the ratio, a reduction in the number of traded calls will result in an increase in the value of the ratio. This is significant because the market is indicating that it is starting to dampen its bullish outlook.
Why Option Writers?

Because Option Writers are generally market players with deeper pockets compared to option buyers.
INTERPRETATION OF OPEN INTEREST CHARTS TO UNDERSTAND MARKET TREND:
Open Interest analysis can provide very useful insights pertaining market trend and support / resistance. It is very important for option traders to understand the relation between open interest and market direction. Combining interpretations from Open Interest (OI) and change in OI can give meaning results. Intelligent traders understand that even though OI is a very crucial ‘market indicator’, it should be combined with other technical indicators to get good results.
OPEN INTEREST TO DETERMINE SUPPORT AND RESISTANCE:
Open Interest data can give very useful clues to determine Support and Resistance. e.g. if 6000PE has highest open interest, traders perceive it as important support for the current expiry. Keeping in view that most institutional investors write options rather than buy, the data helps to understand mood of ‘intelligent money’. Similarly if huge open interest is build for 6200 calls it will be seen as major resistance zone. If the expiry is near than the market may stay range bound between these two levels.


