Moving Average MACD Combo
Post on: 16 Март, 2015 No Comment

In theory, trend trading is easy. All you need to do is “Keep on buying when you see the price rising higher and keep on selling when you see it breaking lower.” In practice, however, it is far more difficult to do successfully. When looking for trend-trading opportunities, many questions arise such as:
What is the direction of the trend?
Should I get in now or wait for a retracement?
When does the trend end?
The greatest fear for trend traders is getting into a trend too late, that is, at the point of exhaustion. Yet despite these difficulties, trend trading is probably one of the most popular styles of trading because when a trend develops, whether on a short-term or long-term basis, it can last for hours, days and even months.
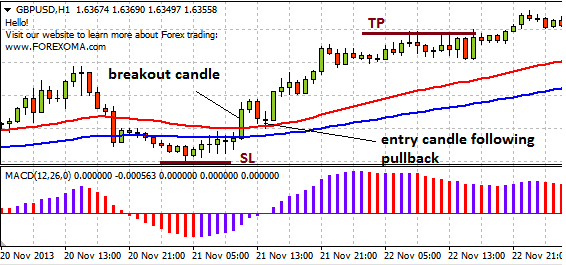
We have developed a strategy that answers all of the questions above while at the same time giving us clear entry and exit levels. This strategy is called the moving average MACD combo. We use two sets of moving averages for the setup: the 50 simple moving average (SMA) and the 100 SMA. The actual time period of the SMA depends upon the chart that you use. This strategy works best on hourly and daily charts. The 50 SMA is the signal line that triggers our trades, while the 100 SMA ensures that we are working in a clear trend environment. The main premise of the strategy is that we buy or sell only when the price crosses the moving averages in the direction of the trend. Although this strategy may seem similar in logic to the “momo” strategy, it is far more patient and uses longer-term moving averages on hourly and daily charts to capture larger profits.
Yet this strategy is far from foolproof. As with many trend-trading strategies, they work best on currencies or time frames that trend well. Therefore, it is difficult to implement this strategy on currencies that are typically range bound, like EUR/GBP. The chart above shows an example of the strategy failing. The price breaks below the 50- and 100-hour SMA in EUR/GBP on March 7, 2006, by 10 pips. We check that the MACD is negative at the time, so we get our green light to go short 10 pips below the moving average at 0.6840. The stop is placed at the highest high of the past five bars, which is 0.6860. This makes our risk 20 pips, which means that our first take-profit level would be two times the risk, or 0.6800. EUR/GBP continues to sell off but not quite strongly enough to reach our take-profit level. The low in the move before the currency pair eventually reverses back above the 50-hour SMA is 0.6839. The reversal eventually extends to our stop of 0.6860 and we end up losing 20 pips on the trade.
Therefore, traders implementing the moving average MACD strategy should make sure they do so only on currency pairs that are typically very trending. This strategy works particularly well on the majors. Also it might be smart to check the strength of the breakdown below the moving average at the point of entry. If we looked at the average directional index (ADX) at that time, we would have seen that the ADX was very low, indicating that the breakdown probably did not generate enough momentum to continue the move.
This article is a part of “High Probability Trading Setups” ebook by Kathie lien and Boris Schlossberg


