Momentum Indicator
Post on: 16 Март, 2015 No Comment

Module 5: Technical Indicators
Lesson 3: %R Momentum Indicator
My favorite momentum indicator is the Williams Percent R.
There are several stock market indicators that one can use, but this is my favorite.
It has by far made me more money than any other stock market indicators I’ve used. Even though this has been my experience that does not mean that it’s the best indicator for you to use.
The Williams Percent R is another indicator that measures overbought and oversold levels similar to the slow stochastics oscillator. You may in fact want to go back to that lesson to review the meaning of overbought and oversold .
A momentum indicator is just a tool which seeks to predict future market trends by using recent price and volume data. It allows you to see where the current price stands in relation to its historical trend.
It can also aid in assessing whether a recent change in trend will continue or revert to its prior state.
Williams Percent R
Momentum Indicator
The indicator measures overbought and oversold market conditions. It’s usually plotted on a chart using negative numbers with a scale ranging from 0 to -100.
On most stock charts you will see two horizontal lines at the -20 and -80 levels. This represents the overbought / oversold areas of the indicator and serve as your trigger lines.
If you recall from the previous lesson, a trigger is when a market condition that you specify is met. It alerts you to the fact that a potential trade is on the horizon .
In the Williams Percent R legend you will see a value (14) in parenthesis. The number represents the number of periods used to calculate the Williams Percent R.
A lower number will often give you more frequent overbought/oversold signals and a higher number will give you less overbought/oversold signals. If your charting software allows you to, I recommend you change the numbers to see how it affects the indicator.
Trading With the
Williams %R Momentum Indicator
Part of the reason I’ve enjoyed trading stock options with the Williams Percent R indicator is because it’s so simple to use. It’s so simple that it often offends traders who are looking for complex systems to trade with.
Essentially, this is how I use this particular stock market indicator:

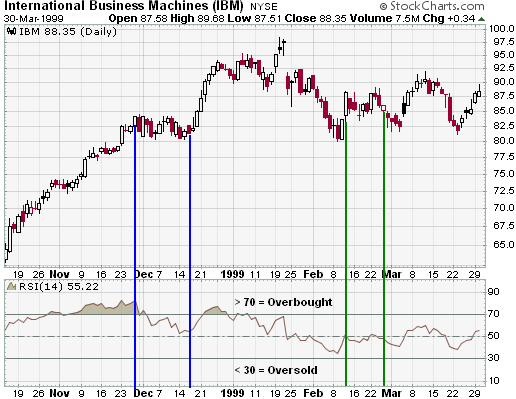
With Williams Percent R, oversold conditions are indicated by values in the -80 to -100 range and overbought conditions are signaled by values in the 0 to -20 range.
- First, I identify the current price trend of the stock and then I look for trading opportunities in the direction of the trend.
- In an uptrend, I look for oversold signals to establish bullish positions.
- In a downtrend, I look for overbought signals to establish bearish positions.
- Once the stock becomes overbought or oversold, I wait for some type of confirmation that a price reversal has occurred.
The reason I look for confirmation is because if you have confirmation, then you will likely avoid signals like #2 in the picture above. You will note that the Williams Percent R indicator produced an oversold signal, yet prices continued in the downward direction.
With signal #1 you have another oversold signal, but this time prices continued higher.
It is important to note that when stock market indicators are in oversold territory it does not necessarily means it’s time to buy Calls, and overbought signals do not necessarily mean it’s time to buy Puts.
A security can be in a downtrend, become oversold, and remain oversold as the price continues to trend lower.
Once a security becomes overbought or oversold, traders should always wait for a confirmation that a price reversal has indeed occurred.
Trading stock options with the Williams Percent R indicator can lead to huge profits. It’s very easy to use and it’s especially ideal for new traders.
Module 5: Technical Indicators


