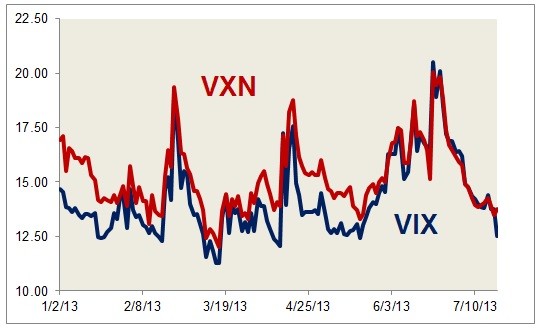
Market VIX and VXN Charts
Post on: 22 Сентябрь, 2015 No Comment

Volatility studies are widely used in options trading. Volatility is simply the fluctuation of contract price (in this instance) and measurements of this particular volatility help option traders to zero in on contracts that offer the best bang for the buck. These measurements also have the additional benefit of indicating whether significant sentiment trends are forming. Generally, Puts tend to increase in volatility as the market is dropping. Conversely, Calls increase in volatility when the market is rising. As with the P/C Ratio, Call buying is associated with optimism, and Put buying with pessimism. Puts are also used as a way to short the market, but without some of the dangers of selling short. They therefore offer a pretty good insight as to how strongly traders feel the market will be trending down. People are more afraid of losing money than they are of not making it. In a falling market, the demand for Puts goes up, along with the price (just like your car insurance premium might, if there was suddenly a rash of car thefts).
To measure this volatility, the CBOE developed the Volatility Index (VIX). The original VIX specifically measured volatility based on the implied values of eight S&P 100 (OEX) options that, when combined, calculated this weighted index. To create a tradable index, in 2003 the CBOE recalculated the VIX based on the S&P 500. The original VIX was renamed the VXO. In January 2001, the CBOE started providing intraday volatility data for options on the NASDAQ 100 (NDX). Originally created in 1995, this volatility index is called the VXN.
Interpreting the data: Readings of 40.00 or greater in the VIX, and 65.00 or greater in the VXN, are considered bearish for the market, and exteme readings often signal lows or bottoms. For example, the VXN had reached 90.00 at the beginning of the 2001, before the NASDAQ reversed its steep decline and rallied for a number of weeks. In rallying markets, a VIX below 20.00 and VXN below 40.00 are considered extremely bullish and may warn of an impending top. The S&P 100, for example, gave a VIX reading of 19.50 at the end of August 2000, signaling a top for the summer rally. The markets began a major decline on September 6th. In a sense, the VIX and VXN may be considered leading indicators, since extremes generally imply impending trend reversals.
In our daily charts, we plot the VIX and VXN values against charts of the OEX and NDX, respectively, along with their respective moving averages. A couple of key things to look out for include crossovers by the VIX or VXN of their moving averages, and crossovers between the volatility data and price data. In the case of the latter, the further apart price data and volatility data are, the more alert we need to be to impending tops or bottoms. Lastly, we include a VIX/VXN Composite chart, that combines both data as a help in studying sentiment marketwide. Click to see our VIX and VXN charts.


