MACD Indicator
Post on: 10 Сентябрь, 2015 No Comment

Module 5: Technical Indicators
Lesson 5: The MACD Indicator
The MACD indicator is a popular technical indicator used to produce or confirm buy and sell signals in the stock market. It’s a great confirming indicator for online options trading.
Because stock options are so volatile, you need a technical indicator that’s stable and prevents you from getting in and out of trades prematurely. This is where the MACD comes in handy.
I primarily use the MACD indicator as a confirmation tool. I evaluate the MACD before I enter a trade and once the trade has already been established, I look to see if the MACD is signaling me that the trend is changing.
The term MACD stands for Moving Average Convergence Divergence and is usually pronounced like so: Mack-D.
The MACD indicator is the first of two lagging technical indicators I’m introducing you to. You’ve come a long way since Module 1 Lesson 1: explain option trading and you’re almost to the end.
In the next learning module you’ll begin to see how everything ties together to result in a profitable online options trading business.
Understanding the MACD
The MACD is a technical indicator that is made up of two exponential moving averages .
In the stock volume lesson, I introduced you to the concept of divergence (disagreement). It essentially means that object A is going in one direction and object B is going in the opposite direction.
The opposite of divergence is convergence. Convergence is when object A and object B are coming together.
You combine the two and you have the Moving Average Convergence Divergence (MACD). The two moving averages are either coming together or moving apart from one another.
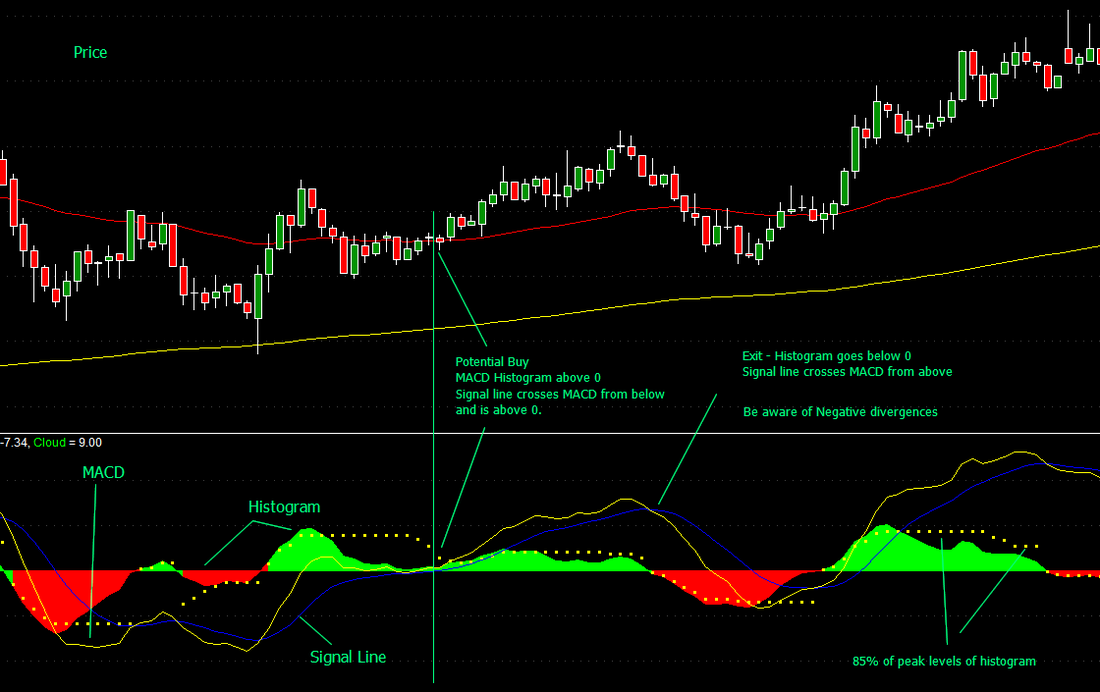
The MACD is made up of two lines. One line shows the relationship between the difference (subtraction) of two moving averages of prices. The second line, called the signal line, is then plotted on top of the first MACD line.
Making Money With the MACD
As you learn more about the use of technical indicators with online options trading, you will find that there are many uses for them. I use the MACD as a confirmation tool.
If you recall in some of the earlier lessons I stressed the importance of waiting for some type of price confirmation before you enter a new trade. The MACD is one of the price confirmation tools that I use.

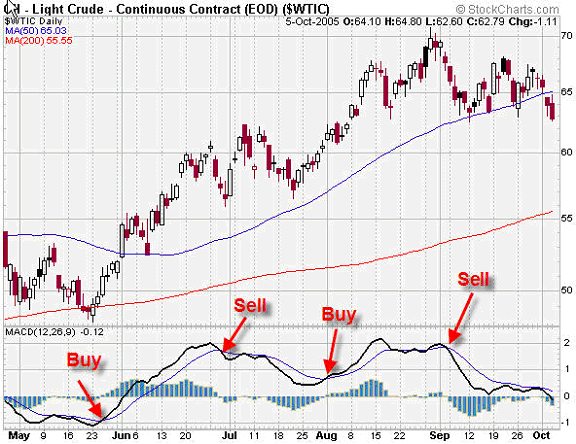
The confirming signal that I use for the MACD is when the signal line crosses either up or down through the MACD line.
If you note in the picture below the relative strength indicator produced a signal to enter a long trade (up direction) at Point 1. However, the MACD was still trending down.
The MACD did not confirm that prices were going to continue to go higher .
At Point 2 the relative strength indicator gave us another signal to go long and roughly 4-6 days later, the MACD signal line crossed up and through the MACD line .
This would be the price confirmation that I was looking for. And as you may notice, prices did indeed continue in the up direction.
The example illustrates why traders use technical indicators. Without the MACD and the relative strength indicator, it would be hard for some people to see this kind of price action clearly.
Don’t forget the lesson I shared with you on support and resistance because even though the MACD gave you confirmation, you still would have had to pay attention or be on guard to the overhead resistance around $27.
I’ve barely scratched the surface on the many uses of the MACD indicator. To learn a bit more about the tool, please watch the short video below and then check out the tutorial on the MACD indicator over at StockCharts.com .


