Janet Yellen and Today’s Breakout Trade in Gold Futures
Post on: 16 Апрель, 2015 No Comment

This originally appeared as a blog post in Scott Hoffman’s Futures Insight Blog on Wednesday, May 07, 2014.
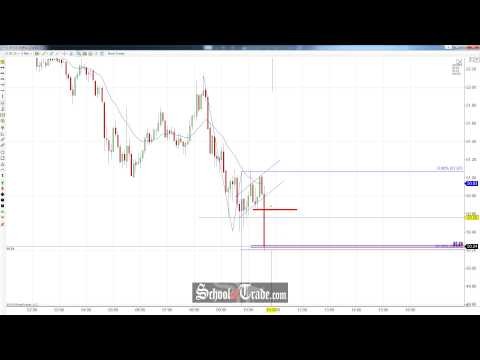
Gold futures had a breakout setup for today. As Fed Chair Yellen’s Congressional testimony was one of the most anticipated economic events of the week, it was a likely candidate to cause a breakout move.
On Tuesday the gold futures had an inside day, an NR7 (narrowest range of the previous seven sessions) and a doji bar. These patterns combined to tell us to anticipate a breakout, directional move today. Rather than try to guess as to how Yellen’s testimony would affect gold, we could watch it and be prepared to trade it if it made the anticipated breakout move.
When a market has a breakout setup, the previous session high and low are the first levels to use as reference prices for a breakout trade entry. In this case, we would look to go long June gold futures if it rallied above the Tuesday high of 1314.30 or we would short it on a move below Tuesday’s low of 1304.40.
As I was writing the Swing Trader’s Insight Morning Watch List it had already moved below Tuesday’s low. If you took this short, it proved to be a relatively low risk entry, as the market never got more than about a dollar back above that level.
I usually don’t take trades if I know there will be a data release or news event after the trade entry. A market’s action before the event may or may not tell us what it is likely to afterward and the odds of increased volatility tend to add to the risk.
On the other hand, looking for trade entries after the news often gives a better opportunity. Other traders are likely to trade emotionally and impulsively; these are the type of conditions that the Taylor Trading Technique seeks to exploit.
We anticipated a breakout move today however gold had already broken below our first reference price of Tuesday’s low. We needed to find another price level to use to confirm a new leg in the downside breakout; I chose to use the 20 day EMA. It had done a good job of serving as a daily reference price and a drop below there (and the $1300 level) could indicate the selloff was resuming.
Depending on how far below the EMA you looked to enter, you could have gotten short any time between 8:45 AM and the 9 AM release of the transcript of Yellen’s prepared testimony. As has recently been the case, official commentary from the Fed led to a sharp selloff.
The initial stop loss could go back above Tuesday’s high. This was a reasonable risk and if it regained Tuesday’s high then we would want to reassess whether we wanted to be short. As it was, the 9 AM selloff was sharp, making a session low of 1293.00 within five minutes. The Fibonacci retracement level at 1293.90 (a 50% retracement from Thursday’s low to Friday’s high) was a logical reference price to observe whether the selloff would continue or reverse; holding this level was a good signal to cover shorts and take a quick profit.
The risk of loss in trading futures contracts or commodity options can be substantial. View the risk disclosures below.


