Iron Butterfly Spread
Post on: 8 Апрель, 2015 No Comment

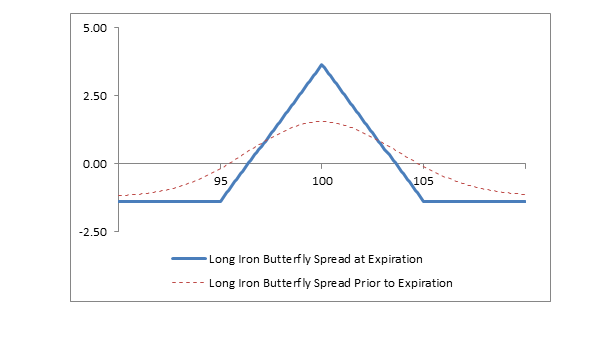
The iron butterfly spread is a complex, neutral, credit spread strategy, similar to a long butterfly spread. A trader profits from an iron butterfly spread when the underlying stock is stagnant or trades in a tight price range over the life of the spread.
An iron butterfly spread is made up of four options trades at once, or two options spreads (a call and a put spread). Both calls and puts are used in the iron butterfly. If executed properly, this strategy has a higher potential loss than potential gain, but the breakeven point is much narrower than the typical debit spread. Both gains and losses are capped.
Because the iron butterfly is a credit spread, you’re collecting option premiums. That means option time decay is working in your favor.
Let’s take a closer look at the options in a butterfly spread…
As mentioned earlier, the iron butterfly spread is made up of four option trades, or two spreads. For one iron butterfly spread, you buy one out-of-the-money (OTM) call and sell one at-the-money (ATM) call (the call spread), and buy one OTM put and sell one ATM put (the put spread). It’s important to note, the ATM put and call are the same strike.
The choice on which OTM call and put you buy depends on what range you expect the underlying stock to trade in. However, the OTM strikes will each be the same distance from the ATM strike.
Let’s look at an example…
Stock XYZ is trading at $50 per share. Let’s say it’s November and you think XYZ is going to trade in a range between $49 and $51 for the next couple of months. To put on one January 49-50-51 iron butterfly spread, here’s what you’d do…
- Buy one Jan 49 Put
- Sell one Jan 50 Put
- Buy one Jan 51 Call
- Sell one Jan 50 Call

Now, let’s add theoretical prices to these options so we can calculate profit/loss potential.
- Buy one Jan 49 Put for $0.65
- Sell one Jan 50 Put for $1.00
- Buy one Jan 51 Call for $0.65
- Sell one Jan 50 Put for $1.00
The total credit you receive is $0.70 per spread ($0.65 + $0.65 – $1.00 $1.00).
Remember, you expect XYZ to trade in the $49-$51 range, so your maximum profit will be right in the middle at $50 upon expiration in January. So, if XYZ closes at $50 in January, your max profit would be the $0.70 per spread you received in credit.
Your breakeven for the trade is if XYZ closes between the OTM strikes on January expiration, after taking into account the spread credit. In this case, your lower breakeven is $49.30 (the 50 strike minus $0.70 spread credit). The upper breakeven is $50.70 (the 50 strike plus $0.70 spread credit).
You lose money on this trade if XYZ closes outside the range of the OTM strikes plus/minus the spread credit (under $49.30 or above $50.70) on January expiration. Your maximum loss is the distance between the OTM and ATM options minus the spread credit. In this case, it’s $0.30 (strike distance of $1 minus $0.70 spread credit).
Remember, this is a good strategy if you expect XYZ to trade in a narrow range through January and close at or near $50.


