Index Annuity Performance Comparing Performance of Index Annuities
Post on: 15 Июнь, 2015 No Comment

Expected Performance
Index annuity performance varies with the market because your investment is linked to the S&P 500, or a similar stock market index. In this respect, index annuities are similar to variable annuities. And although an index annuity balance is impossible to predict, because it tracks a historically documented index like the S&P 500, long-term growth can be estimated with certainty. Most index annuities return 7-10%.
Index Annuity vs S&P 500 Performance
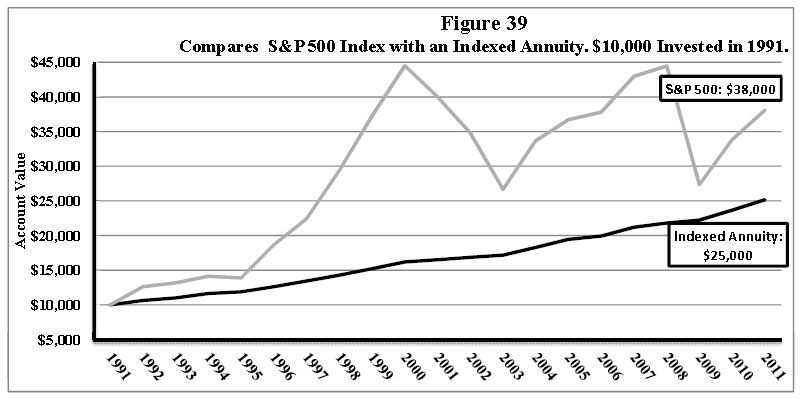
The above is a hypothetical comparison of an index annuity vs a direct S&P 500 investment. This is how your balance would have looked between 1998 and 2008. The index annuity in this example has typical contract terms: 80% participation rate, 20% cap, and a 1.5% annual administration fee.
Comparing hard numbers, a $100,000 investment directly into the S&P 500 in 1998 would have resulted in an approximate balance of $90,000 by 2008. You would have lost nearly $10,000 not to mention inflation. On the other hand, your index annuity would be worth nearly $170,000. The difference is a stark, near-two-fold improvement: $76,855.
Notice that because an index annuity never loses capital, it’s always inching forward and locking in pervious years’ returns. During recessions the index annuity simply plateaus. It might be argued that 2008 was a exception period in the US economy, and that markets will rebound. That being so, the above graph offers two important lessons:
- Even if we assume the 2008 recession never occurred and limit our timeframe to 1998-2007, the index annuity still outperforms the S&P 500 by nearly $20,000 due too the 2001 recession.
- Recessions and down-turns are inevitable over long time frames. In fact, they’re guaranteed every 5-10 years. If that were not the case, index annuities would be foolish investments. But as it is the case, index annuities are sound investments because they average out natural market volatility.

Historical Asset Class Yields
This second chart is a birds-eye-view of various asset classes throughout the 20th century; green and blue represent equity-based and debt-based vehicles respectively. This data offers several useful conclusions:
- Equities outperform debt-based instruments nearly two-fold in the long term.
- The S&P 500’s growth is competitive with averaged-out large and small cap stock investment.
- Debt-based investment instruments outpace inflation, but just barely.
What do these conclusions mean? If you’re looking to seriously GROW wealth, equities are about the only option. But, the problem with traditional equities as part of a retirement is their short-term volatility. Suppose you planned to retire in 2001 or 2008. If you’d been heavily vested in straight-up equities, you’d be out of luck.
Even though the above data shows equities outperforming debt, few of us have the luxury of waiting 10-20 years for the market to correct itself. And the older an investor is, the less this luxury exists. That’s why index annuities make ideal retirement savings plans they average out market volatility AND provide equity-like growth.
Don’t Just Shop, Implement a Solid Retirement Strategy
Purchasing an annuity is a big decision. Online research is a good start, but prudent investors should discuss all their options and risks with an independent financial advisor. Request a free, no-obligation consultation today, along with a report of current rates on brand-name annuities.


