How to Use the Relative Strength Index
Post on: 19 Июнь, 2015 No Comment

J. Welles Wilder invented the Relative Strength Index (RSI) in 1978 when he published its theory in his new book ‘New Concepts in Technical Trading System’. Since then, the RSI has acquired an impressive reputation by becoming one of the most popular technical indicators of all time.
The RSI was designed to monitor and track the historical and present weaknesses and strengths of assets using the closing prices of current time-period. The RSI is categorized as a momentum oscillator because it records the size and velocity of price movements. The RSI also calculates the momentum of these actions as the ratio of lower closes to higher closes. As such, the RSI generates higher readings for assets posting stronger positive fluctuations compared to those registering increased negative variations.
Experts recommend not designing a trading strategy that depends solely on the RSI. However, if you combine the power of the RSI together with other technical indicators and statistical tools then you could create a trading strategy that can be very accurate at identifying new trading opportunities. You can use the RSI to track any asset and the recommended settings for its parameters are 14, 70 and 30. Again, you will obtain best results if you operate the RSI on daily charts or higher.
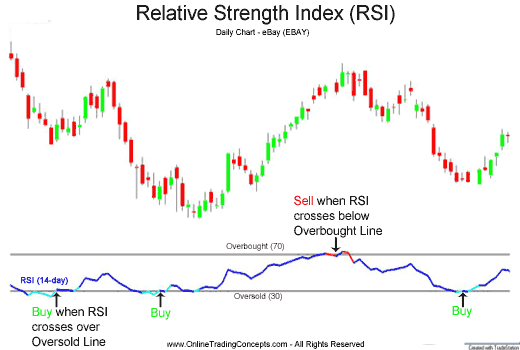
When trading binary options. you should open a new long position if you observe the RSI dropping below 30; creating a bottom and then bounces back upwards, as shown on the next diagram. Similarly, you should go short if you witness the RSI rising above 70; topping and then retracting below 70. You must close your position when you detect the RSI hitting its level 70 (long trades) or level 30 (short trades).
You will find that the RSI performs well at detecting new trading opportunities whether it is incorporated in either simple or complex trading strategies. However, you must take care because the RSI can often produce signals that are easy to misinterpret especially if you have little experience in using it. Many experts advise utilizing the RSI with other technical indicators which you can then use to confirm it readings.
You should also be aware of the following problem when you utilize the RSI:-

Although the RSI may be posting readings above 70 or below 30, you must understand that price does not know this. As such, price could still continue to advance in its current direction by a significant amount after the RSI has registered these conditions without the expected retraction occurring.
Consequently, the selected asset could still surge by hundreds of points while the RSI records just a small change e.g. 70 to 74. You must be acutely aware that this can happen because if you had opened a new SELL position at RSI 70, then a strong BULL advance could quickly stop out your new trade.


