How to Understand CandlesticksReversal Candles
Post on: 16 Март, 2015 No Comment

An understanding of reversals candles can help to manage existing trades or an entry on a new trade.
A single candlestick can be a reversal signal, but a grouping of them can be even more powerful and show the struggle with price and moving higher or lower.
The upper and lower shadows become the point of interest, when we see many lined up together it shows us the price struggle. A tug of war presents itself in the form of long shadows (wicks) on candles and a smaller body shows an even more powerful struggle.
Candlesticks are made up of an opening price, closing price, the high of the time frame and the low of the time frame. The opening and closing price form the body of the candlestick, while the highs and lows form the shadows on the candlesticks. Shadows are often referred to as wicks or tails on the body. But no matter what you call them they are showing the extended range outside of the opening and closing price of the time frame and how the bears or bulls pulled the price back in after the extension.
Shadows — A bearish signal a long upper shadow and bullish a long lower shadow, but as with all candlestick patterns, where it appears is important.
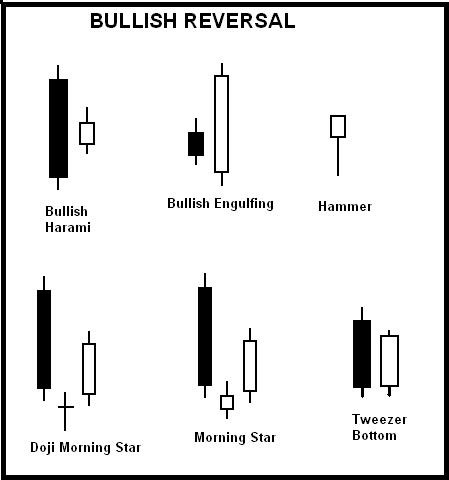
The Hammer – A reversal indicator after a significant downturn (long lower shadow is bullish).
Hanging Man – A reversal indicator after an uptrend (long lower shadow is NOT bullish).
Shooting Star – A reversal indicator after an uptrend (long upper shadow is bearish).
A little information to help identify and clarify the difference between the hammer. hanging man. and the shooting star :
Shooting Star—Must appear after an uptrend. The shooting star’s long upper shadow reflects market rejection of higher prices.

Hammer—A long lower shadow candle that must appear during a downtrend.
Hanging Man—A long lower shadow candle that must appear during an uptrend.
More sophisticated indicators and patterns come once the basics are established on identifying key candlestick forming and intermediate or bigger trends. Once that can be done adding onto the candlestick vocabulary become very easy and helps to refine trade management and trade entries. Identifying risk is key to success and once the pattern is in place the candlestick helps to lay that risk out in simple terms. The reversal confirms and moves the other direction or it does not at that point. Determining if the trade is right or wrong comes in the next few candles, which can be minutes if the trade is done on a short term basis or days if on a daily chart.
Watch for Upcoming Candlestick Reversal article as #3 of 4 in the series.
Teresa is the founder and CEO of TradeLogic, LLC. She started trading while pregnant with her first son (Troy) and not only was that a blessing, it was the start of a new career. 1997 was the big market boom when you could hear even Grandmother’s at the grocery store talking about trading. Teresa is self taught and reading for hours to her newborn (trading books of course, not Dr. Seuss) helped to keep her sane and upbeat. After trading stocks and options for two years son number two (Trevor) came along and that is when stock index futures became VERY appealing to Teresa. Less homework and fewer things to focus on allowed her to trade full time and take care of two children. Yes, the challenge of a two year old and newborn should have been enough, but always striving to do more and the queen of multitasking Teresa managed to jump right into stock index futures. This meant leaving stocks and options behind for a few years. She has returned to them now and enjoys every moving market.
Please visit my website for more information.
This article is intended solely for information purposes. The opinions are those of the author only. Please conduct further research and consult your financial advisor before making any investment/trading decision. No responsibility can be accepted for losses that may result as a consequence of trading on the basis of this analysis.
Information, charts or examples contained in this lesson are for illustration and educational purposes only. It should not be considered as advice or a recommendation to buy or sell any security or financial instrument. We do not and cannot offer investment advice. For further information please read our disclaimer .


