How to read India VIX and Strategies to trade nifty future volatility
Post on: 25 Март, 2016 No Comment

by Bhaveek Patel 10 comments
In India, markets have seen significant increase in the volatility index. We have VIX in NSE, which have recently been inching towards 20. Let us see in detail how VIX is used in trading nifty future. Few traders are using VIX to see the correct direction of Nifty future and also find the correct and most probable reversal point. VIX also defines the risk for the nifty positional traders and also option writers .
What is volatility index VIX?
Before learning the volatility index lets understand what is volatility. So volatility is the amount by which the price fluctuates in a period of time. It is measured by some mathematical calculations I dont want to go in that detail. Volatility index shows this fluctuation of prices over a given period.
How volatility is measured?
In NSE, there is a special index for measuring the volatility, it is India VIX. One can even see the charts of VIX on real time basis. However there are technical indicators, that can be used to measure volatility in the market. Bollinger bands and Average True Range (ATR) are most commonly used to keep track of price fluctuations and the volatility.
The India VIX uses the implied volatility of NSE NIFTY options and is helpful in predicting overall market volatility for the next 30 days.
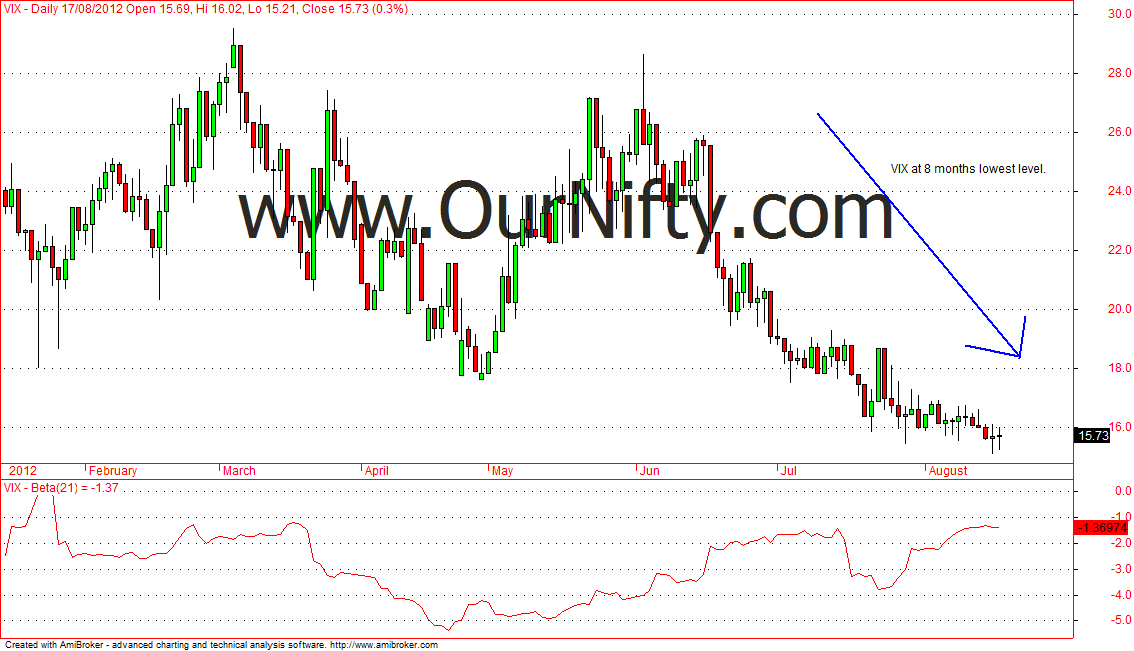
A falling VIX means that there is lower uncertainty and market confidence is high and most of the time direction of trend is clear. A rising VIX shows there is a lot of uncertainty in the markets and price action is expected to be very volatile or sensitive in the coming days.

How trading can be done using VIX?
Well, we know that high volatility makes the markets thin / sideways/ range bound or volatile. So while looking for a trade in nifty future or nifty option writing one must check that, if the volatility is low so that trend traders can be on the right side of the trade. Now if a trader is writing nifty options then he must check the volatility before taking the trade, since high volatility will make the price fluctuate and may even see reversals in no time so trading risk gets increased. On the other side if you are a trend trader for nifty future and want to confirm if the current trend will sustain for some time then traders must see lower volatility in VIX chart. If nifty is trending with low volatility then it is most likely to continue moving in the same direction.
I will recommend to trade only when the VIX is moving lower and a level below 20 is ok for trading. But if the VIX goes above 20 it means the chances of reversal in the short term trend is very high and large sudden moves could be expected.
You Should Read This:
- Nifty future is ready for Breakout, VIX at 8 months low Nifty future has been trading in its medium term trading range, but VIX is now inching lower. According to charts Volatility index VIX is seen at lowest level in last 8 months. This lower VIX.
- What is Nifty Future and How to trade it with Trend tool Beginners who see markets on TV often ask me what is nifty future and how it is traded, what are the benefits of it, how to find out the trend. Here are the answers to.
- Chinese GDP data, Why Nifty future will trade lower this week We are predicting that nifty future is going to trade lower this week, here is the main reason behind our analysis. On Friday, Chinese real GDP data is due to be released, previously this number.
- Nifty Futures Trading With high Volatility Today, F&O Expiry of August Series, Add Short Positions in Nifty Futures Below 4960 Nifty futures is trading very volatile as today is F&O expiry of August series. We are expecting the markets to extend the selling in todays session. Yesterday we have seen the American markets trading positive.
- Trade Nifty Future Using Fibonacci Support Resistance Levels with High Accuracy Fibonacci retracement levels are highly used by professional traders, as these levels acts as support resistance. This tool just needs recent high (Swing High) and recent low (Swing Low) to plot retracement levels over the.


