How to Read a Balance Sheet Stock Investing
Post on: 8 Июль, 2015 No Comment

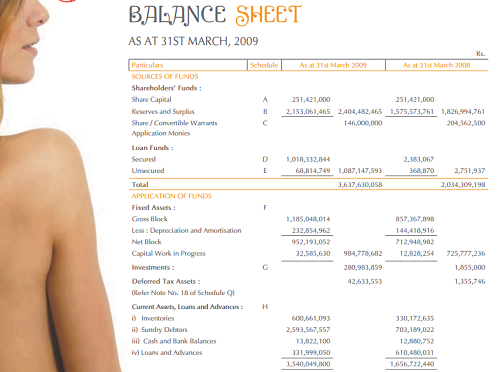
NEW YORK ( TheStreet ) — While a company’s income statement presents the current results of a company’s operation, the balance sheet depicts the financial strength (or weakness) of a company.
So what’s in a balance sheet?
- Assets: Items of economic value that are owned by a company.
- Liabilities: A company’s financial obligations.
- Equity: Sometimes referred to as shareholders’ equity, this represents the net accounting value of the company.
And the basic formula of a balance sheet is:
Assets = Liabilities + Equity
Now, instead of launching into a full-blown lesson on an accountant’s perspective of the balance sheet, I’m going to look at balance sheets from an investor’s perspective. In this installment of The Finance Professor, I’ll cover how to diagnose the three degrees of a company’s financial health, by looking at various companies with strong balance sheets, weak balance sheets and balance sheets that are under improvement.
I will refer to numbers that can be found on the balance sheets for the most recent available quarter (first quarter of 2007), which are available at company Web sites and summarized on Yahoo! Finance and TheStreet.
How to Spot a Weak Balance Sheet
Let’s start with an example of a truly horrible balance sheet. I have several nominees for this ignominious honor: Six Flags. Level 3 Communications. Sirius Satellite Radio and XM Satellite Radio. (How ironic it is that Sirius and XM, two companies with some of the worst balance sheets, are attempting to merge? Two wrongs won’t make a right.)
Rather than pick one of those four balance sheets, I will discuss many of the problems that plague all or some of these companies, including:
- Negative or deficit retained earnings
- Negative equity
- Negative net tangible assets
- Low current ratio
Negative or deficit retained earnings:
Retained earnings represent the cumulative net income of a company. When a company has a negative retained earnings balance, it says to the world that it has generated accounting losses over a prolonged period of time. Here are the retained earnings, in millions, for Six Flags, Level 3, Sirius and XM — taken directly from the most recently available quarterly (first quarter of 2007) balance sheets:
- Six Flags: -$1,560.20
- Level 3: -$9,586.00
- Sirius: -$3,978.47
- XM: -$3,620.91

Negative equity:
When the deficit in retained earnings surpasses the amount of capital that the company has, this is a red flag that signals that the company is in distress.
When a company is in distress, it has two options. Option one is to recapitalize its balance sheet by issuing additional capital (selling common or preferred stock). If that’s not possible, then the other option is to file for bankruptcy.
Two of the companies I pointed out earlier — satellite radio twins Sirius and XM — have negative equity. Those companies chose to merge. Whether or not that merger occurs, I think that in the long run, one of them, both or a combined company may see its destiny in Federal Bankruptcy Court.
Negative net tangible assets:
This is caused by an excessive amount of goodwill. Goodwill, or G/W, is the value paid by an acquiring company in excess of the book value of the acquired company. G/W sits on the balance sheet like an ugly mole and has to be amortized (expensed) over a period of time.
However, while G/W has an accounting value, it has no economic value. You cannot sell G/W or exchange it for cash. Thus, G/W has to be made up by successfully operating the acquired company. Net tangible assets is equity less G/W. All of the companies I mentioned have negative net tangible assets (below amounts in thousands):
- Six Flags: — $848,776
- Level 3: — $803,000
- Sirius: — $505,564
- XM: — $650,089
Low current ratio:
The current ratio is derived by dividing a balance sheet’s current assets amount by its current liabilities amount. This ratio represents the ability of the company to meet its short-term obligations, such as accounts payables and current portion of long-term debt, from readily available sources, such as cash, short-term investments, accounts receivable and inventory.
A high current ratio indicates a liquid company. A low ratio indicates that the company will have problems meeting its short-term obligations, and it could spell more-significant problems. Look for companies with current ratios of at least 1.00 — but to be on the safe side, add some room for comfort and look for a slightly higher ratio.
Sirius, XM and Six Flags all have low current ratios (see below), and this is not a good sign. And even though Level 3 has a current ratio of 1.44, it is saddled with a great deal of long-term debt, which is another red flag.
To recap, total current assets divided by total current liabilities equals current ratio:
- Six Flags: $155,308 / $496,294 = 0.31
- Level 3: $1,504,000 / $1,043,000 = 1.44
- Sirius: $479,802 / $750,702 = 0.63
- XM: $432,658 / $694,322 = 0.62
Be careful, though, with the current ratio. While it can be helpful if you’re doing a quick scan, you still need to dig further into a company’s balance sheet. Also, the current ratio will vary among different industries. For example, within aerospace, Boeing has a current ratio of 0.79, but I would hardly consider Boeing to have a bad balance sheet.
How to Spot a Strong Balance Sheet
It would be easy to state that a strong balance sheet has none of the problems of a weak balance sheet, but that is not necessarily the case. There is nothing wrong with having G/W, and G/W appears on some fantastic balance sheets. It is the magnitude of G/W in relation to the company’s overall balance sheet that separates the financially strong companies from the financially weak ones. Certainly, a high current ratio would be a welcome sign of a good balance sheet. Again, you need to be careful to only use the current ratio as a starting point.
So what are some of the other standout metrics of a good balance sheet? Here are a few key indicators of strength:
- Cash and short-term investments
- Low or zero long-term debt
- Undervalued assets
Cash and short-term investments:
Nothing signals a strong company more than piles of cash and short-term investments (such as CDs or T-bills). This will not only provide coverage for the payment of current liabilities, but it will also give a company the ability to return value to shareholders. How? Companies can return the cash to shareholders through stock repurchases and dividends.
Low or zero long-term debt:
We all live our lives in the hope of not having to pay off our home mortgage. Companies are no different. Long-term debt is money that companies borrowed that needs to be paid back in more than one year and could be due in as much as 30 years. Companies with balance sheets that are not saddled with debt are among my favorite kind to invest in.
For the reasons that I mentioned above, some of my favorite balance sheets belong to Apple. Google and Microsoft.
Recent Quarterly Balance Sheet Data


