Gann Time Clusters Indicator
Post on: 30 Май, 2015 No Comment

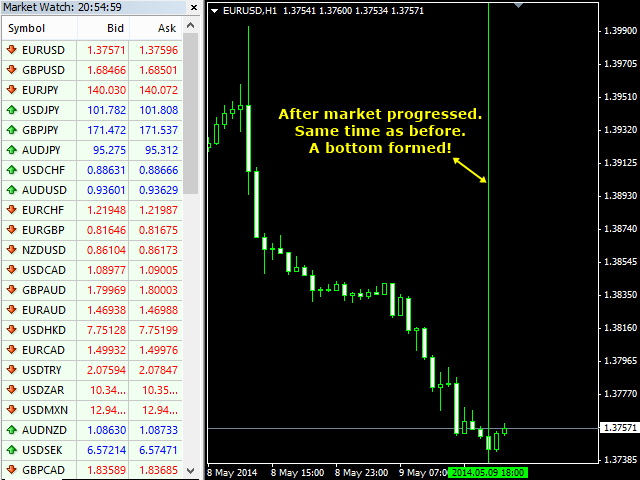
This indicator is based on W. D. Gann’s Square of 9 method for the time axis. It uses past market reversal points and applies the mathematical formula for Gann’s Square of 9 and then makes projections into the future. A date/time where future projections line up is called a ‘time cluster’. These time clusters are drawn as vertical lines on the right side of the chart where the market has not advanced to yet. A time cluster will result in a market reversal point (ex. bottom or top) forming at this exact time. The lines are drawn well in advance which makes this a unique indicator.
- The indicator does not repaint, move, or delete lines! It also does not lag because the lines are drawn many bars in advance.
- Only 3 adjustable settings. So it is easy to use and understand.
- It can be used for Forex trading and possibly for binary options trading.
- There is no need to constantly watch the chart, since all lines are drawn ahead of time and the future times are clearly marked.
- It is easy to trade with. Since market reversals will occur, simply trade the reverse of whatever direction the market was moving. For example, if the market was moving down then place a buy order, and vice versa.

- Min_Cluster_Number
This is the minimum number of projections required to be considered as a time cluster. So this controls the reliability and the number of future lines. The higher the number, the more reliable the future lines will be but the fewer lines will be drawn. And vice versa for a lower setting.
This controls the number of past candles that the indicator will consider. The higher the number, the more reversal points will be used and greater the chance that future lines will be drawn, but the slower the indicator will be, and vice versa for a lower setting.
This setting controls the color of the vertical lines drawn by the indicator.
- The higher the number set for ‘Min_Cluster_Number’, the better. The lower the ‘Lookback_Candles’, the better. If you see that too many lines are drawn on the chart, adjust the settings to be stricter until only a few lines are drawn. These will be stronger time clusters then. So you should balance the 2 settings with this tip in mind.
- Updates will be made based on customer feedback. Feel free to comment or send recommendations.
- This indicator will work on any MT4 broker and chart.
- The examples below are taken from real live charts.


