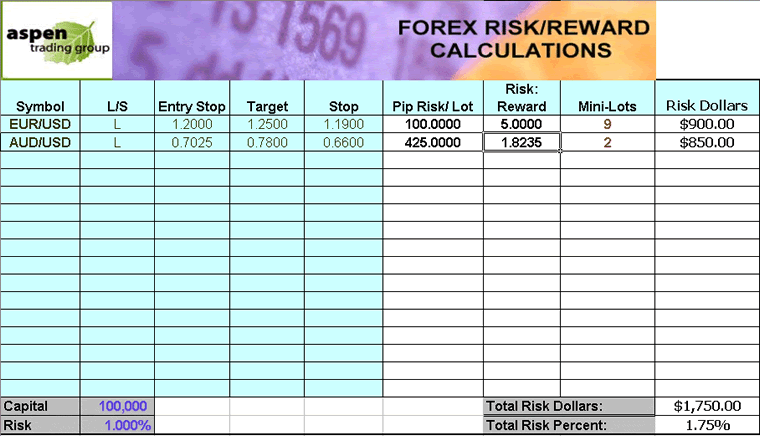
Forex Money Management Calculator
Post on: 16 Март, 2015 No Comment

This money management calculator allows to manage your exposure across multiple trading positions in accordance with your money management strategy. The calculator is made up of five different sections each of which is described in full detail below. You can change all cells that are coloured in red.
1. Account Controls:
Here you specify your account type (Mini or Standard ), the value of your account balance, the maximum percent that you can risk (Total Exposure in % ) and if you want your risk capital (Total exposure in $ ) to be distributed in accordance with each trade’s potential (Yes in the Prioritize cell) or in equal proportions (No in the Prioritize cell). The trade potential is calculated as the expected dollar return on the trade.
2. Trade Controls
This section allows you to enter information about up to 10 different trades. Select the currency pair that you are trading, the direction of the trade (Buy or Sell), the levels of entry, stop-loss and take-profit as well as the success rate of the currency trading system that you use to generate the signals. The success rate (the percentage of the winning signals) should be calculated using the most recent system performance (e.g. the last 50-100 trades). The pip values will appear automatically after you select a currency pair. The values of the pips will be taken from the table at the bottom of the page. The pip values will be multiplied by 10 when the account type is set to Standard in the Account Controls menu.
Note . When trading multiple positions be sure to select for the trading only those currency pairs or trading systems whose correlation is low. You can find information on the current level of correlation between different currency pairs at the currency correlations page. For the demonstration of how correlation between trading systems affects trading performance please visit the system correlation simulator (Please note: The size of this page is 0,7 Mbs and it requires that you have Flash installed and Javascript enabled in your browser).
3. Risk & Reward Parameters
This table calculates the pip and the dollar values of your stop-loss and take-profit, as well as their ratio — the reward to risk ratio. The expected dollar return column (Exp. $ Return) calculates the dollar profit or dollar loss that you can expect from each trade based on their individual reward to risk ratios, the past accuracies of the system (s) (Success column in the Trade Controls section) and the pip values of the currencies that are traded.
4. Recommended Per-Trade Exposure
Here you will find the priority of each trade in relation to the others and the number of lots that can be traded per each trade based on the value of your account balance and the total exposure permitted by your money management system. The trades are ranked according to their expected dollar returns. You will see Avoid in the priority column if the expected dollar return of a trade is equal or smaller than 0. The number of lots that should be traded per position is calculated using the last 4 columns of this section.
The INI % column shows the initial percentage distribution of the risk capital among the trades based on how big their expected dollar return is in relation to the rest — the bigger the expected dollar return the more funds are allocated to the trade. The next column, INI $, calculates the dollar value of the fractions of the risk capital that are given in the INI % column. These fractions are first divided by the dollar value of the stop-loss for each corresponding trade to produce the initial distribution of lots to be traded. The resultant numbers of the lots are rounded down and the total unused capital is then re-allocated in stepwise fashion starting from the trade with the highest priority and going down to the least attractive trade. The final distribution of the risk capital shows up in the # of Lots column as well as the FIN % and FIN $ columns.
The bigger your account (or if you trade on a Mini instead of a Standard account ) the closer the initial percentage distribution of the risk capital will be to the final one. The closeness of fit between these two distributions will be shown by the Allocation Efficiency cell in the Account Controls menu. You can expect to see the same allocation efficiency on a Standard account as is on a Mini account if you have ten times more money in it (e.g. allocation efficiency on a 20k mini account will be same as the allocation efficiency on a 200k standard account with identical trade details). This highlights the importance of trading on the Mini accounts if you are insufficiently capitalized (i.e. have less than 50k in your account).
5. Pip Values in $ per 10K Lot
Here you can enter pip values for the currency pairs that you are trading. The pip values that you enter in this table will be automatically used whenever you select the corresponding currency pairs in the Trade Controls menu. This table contains pip values that were valid at the time of the creation of this money management calculator. You might need to update some of the pip values manually, using the information from one of the pip value calculators that can be found on the internet. You can also enter pip values for four currency pairs which are not represented in the table — using the CUSTOM fields at its bottom.


